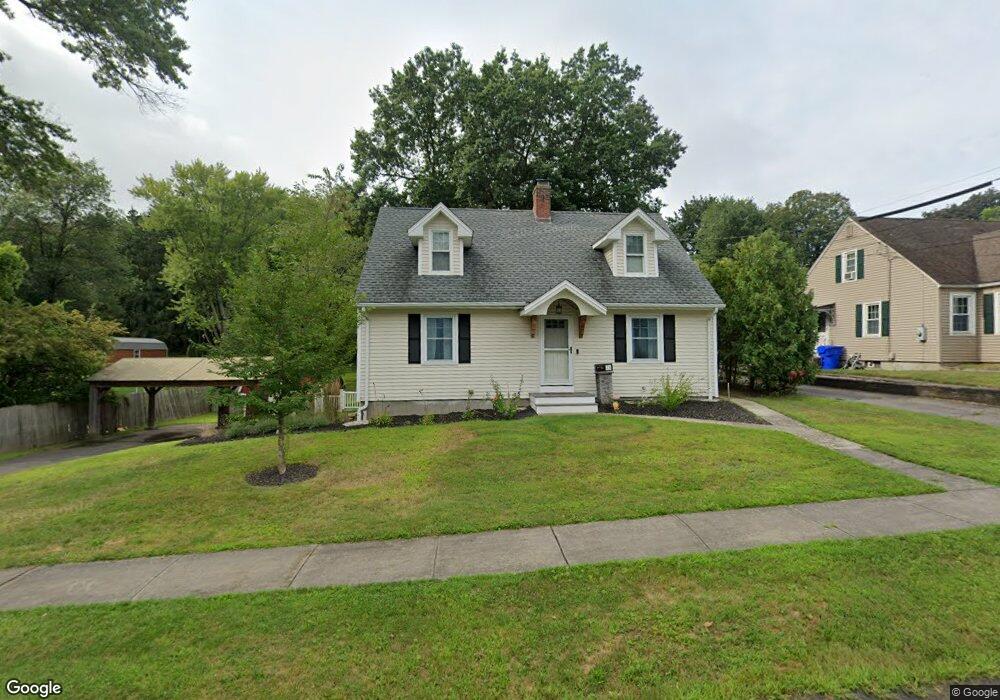
23 Parker St Enfield, CT 06082
Estimated Value: $310,000 - $347,000
4
Beds
1
Bath
1,561
Sq Ft
$209/Sq Ft
Est. Value
About This Home
This home is located at 23 Parker St, Enfield, CT 06082 and is currently estimated at $326,069, approximately $208 per square foot. 23 Parker St is a home located in Hartford County with nearby schools including Prudence Crandall Elementary School, Henry Barnard Elementary School, and Enfield High School.
Ownership History
Date
Name
Owned For
Owner Type
Purchase Details
Closed on
Dec 31, 2022
Sold by
Devino Colleen M
Bought by
Devino Jason P
Current Estimated Value
Purchase Details
Closed on
Sep 10, 2012
Sold by
Devino Jason P
Bought by
Devino Colleen M and Devino Jason P
Purchase Details
Closed on
Nov 12, 2010
Sold by
Pumiglia Melanie and Sever Charles
Bought by
Devino Jason
Home Financials for this Owner
Home Financials are based on the most recent Mortgage that was taken out on this home.
Original Mortgage
$168,712
Interest Rate
4.35%
Mortgage Type
Purchase Money Mortgage
Purchase Details
Closed on
Aug 22, 1996
Sold by
Pumiglia Melaine
Bought by
Sever Charles and Pumiglia Melanie
Purchase Details
Closed on
Jan 16, 1990
Sold by
Pumiglia Eric
Bought by
Pumiglia Melanie
Create a Home Valuation Report for This Property
The Home Valuation Report is an in-depth analysis detailing your home's value as well as a comparison with similar homes in the area
Home Values in the Area
Average Home Value in this Area
Purchase History
| Date | Buyer | Sale Price | Title Company |
|---|---|---|---|
| Devino Jason P | -- | None Available | |
| Devino Colleen M | -- | -- | |
| Devino Jason | $171,000 | -- | |
| Sever Charles | $58,250 | -- | |
| Pumiglia Melanie | $125,000 | -- |
Source: Public Records
Mortgage History
| Date | Status | Borrower | Loan Amount |
|---|---|---|---|
| Previous Owner | Pumiglia Melanie | $38,000 | |
| Previous Owner | Pumiglia Melanie | $141,600 | |
| Previous Owner | Pumiglia Melanie | $168,712 |
Source: Public Records
Tax History
| Year | Tax Paid | Tax Assessment Tax Assessment Total Assessment is a certain percentage of the fair market value that is determined by local assessors to be the total taxable value of land and additions on the property. | Land | Improvement |
|---|---|---|---|---|
| 2025 | $6,352 | $170,300 | $53,900 | $116,400 |
| 2024 | $6,182 | $170,300 | $53,900 | $116,400 |
| 2023 | $6,182 | $170,300 | $53,900 | $116,400 |
| 2022 | $5,727 | $170,300 | $53,900 | $116,400 |
| 2021 | $5,216 | $126,950 | $44,620 | $82,330 |
| 2020 | $5,166 | $126,950 | $44,620 | $82,330 |
| 2019 | $5,207 | $126,950 | $44,620 | $82,330 |
| 2018 | $5,095 | $126,950 | $44,620 | $82,330 |
| 2017 | $4,784 | $120,300 | $44,620 | $75,680 |
| 2016 | $4,643 | $118,450 | $44,620 | $73,830 |
| 2015 | $2,816 | $118,450 | $44,620 | $73,830 |
| 2014 | $4,309 | $118,450 | $44,620 | $73,830 |
Source: Public Records
Map
Nearby Homes
Your Personal Tour Guide
Ask me questions while you tour the home.