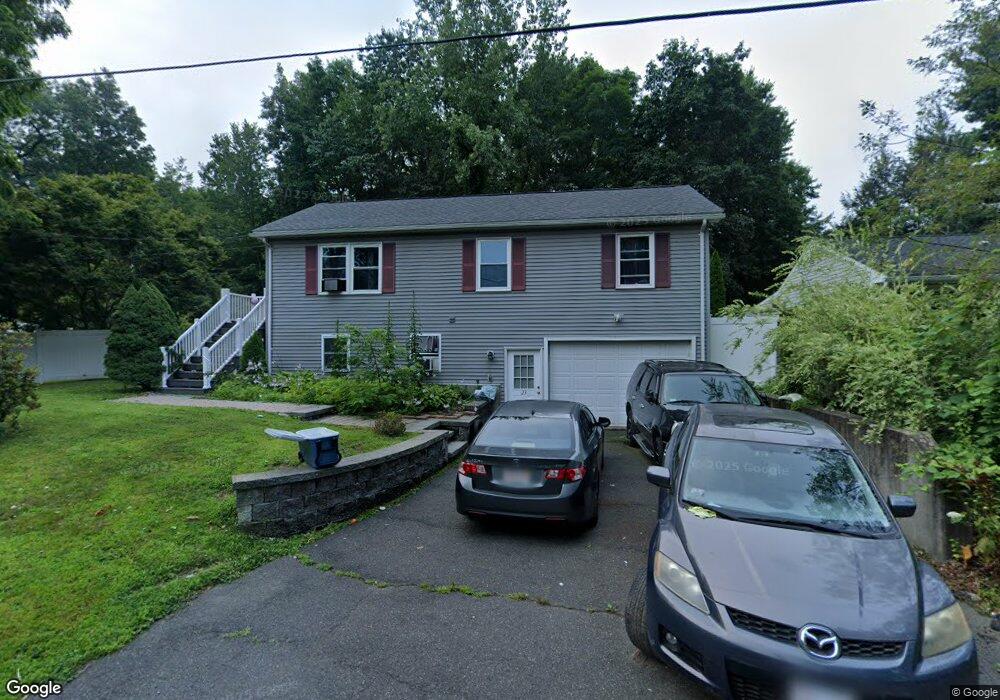
23 Pinebrook Curve Northampton, MA 01060
Estimated Value: $370,000 - $476,000
3
Beds
3
Baths
960
Sq Ft
$439/Sq Ft
Est. Value
About This Home
This home is located at 23 Pinebrook Curve, Northampton, MA 01060 and is currently estimated at $421,433, approximately $438 per square foot. 23 Pinebrook Curve is a home located in Hampshire County with nearby schools including Northampton High School, The Montessori School of Northampton, and Lander Grinspoon Academy.
Ownership History
Date
Name
Owned For
Owner Type
Purchase Details
Closed on
Feb 4, 2013
Sold by
Enz Kathleen M
Bought by
Brown Kendra L and Taylor Neil P
Current Estimated Value
Purchase Details
Closed on
Apr 14, 2003
Sold by
Crippen Steven C and Crippen Susan R
Bought by
Enz Kathleen M and Enz Kathleen
Home Financials for this Owner
Home Financials are based on the most recent Mortgage that was taken out on this home.
Original Mortgage
$149,600
Interest Rate
5.86%
Mortgage Type
Purchase Money Mortgage
Create a Home Valuation Report for This Property
The Home Valuation Report is an in-depth analysis detailing your home's value as well as a comparison with similar homes in the area
Home Values in the Area
Average Home Value in this Area
Purchase History
| Date | Buyer | Sale Price | Title Company |
|---|---|---|---|
| Brown Kendra L | $195,000 | -- | |
| Enz Kathleen M | $187,000 | -- |
Source: Public Records
Mortgage History
| Date | Status | Borrower | Loan Amount |
|---|---|---|---|
| Previous Owner | Enz Kathleen M | $149,600 |
Source: Public Records
Tax History Compared to Growth
Tax History
| Year | Tax Paid | Tax Assessment Tax Assessment Total Assessment is a certain percentage of the fair market value that is determined by local assessors to be the total taxable value of land and additions on the property. | Land | Improvement |
|---|---|---|---|---|
| 2025 | $4,940 | $354,600 | $113,400 | $241,200 |
| 2024 | $5,022 | $330,600 | $113,400 | $217,200 |
| 2023 | $4,449 | $280,900 | $103,100 | $177,800 |
| 2022 | $4,068 | $227,400 | $103,100 | $124,300 |
| 2021 | $3,715 | $213,900 | $98,200 | $115,700 |
| 2020 | $3,594 | $213,900 | $98,200 | $115,700 |
| 2019 | $3,372 | $194,100 | $84,300 | $109,800 |
| 2018 | $3,289 | $193,000 | $84,300 | $108,700 |
| 2017 | $3,221 | $193,000 | $84,300 | $108,700 |
| 2016 | $3,119 | $193,000 | $84,300 | $108,700 |
| 2015 | $3,277 | $207,400 | $93,700 | $113,700 |
| 2014 | $3,523 | $228,900 | $93,700 | $135,200 |
Source: Public Records
Map
Nearby Homes
- 76 Cooke Ave
- 4 Gleason Rd
- 74 Barrett St Unit 105
- 51 1/2 Hatfield St Unit 6
- 16 Taylor St
- 0 Terrace Ln
- 103 Massasoit St
- 5 Prospect Ct
- 61 Woodlawn Ave
- 32 Stonewall Dr
- 8 View Ave Unit A
- 8 View Ave Unit B
- 59 Day Ave
- 76 Crescent St Unit 2
- 13 1/2 Finn St
- 14 Arlington St
- 37 Finn St
- 215 State St
- 50 Walnut St
- 9 Walnut St Unit B
- 23 Pine Brook Curve
- 19 Pine Brook Curve
- 33 Pine Brook Curve
- 16 Pine Brook
- 28 Pine Brook Curve
- 938 Bridge Rd
- 46 Pine Brook Curve
- 9 Pine Brook Curve
- 12 Pine Brook Curve Unit 12
- 48 Pine Brook Curve
- 936 Bridge Rd
- 10 Pine Brook Curve
- 914 Bridge Rd
- 52 Pine Brook Curve
- 1 Cooke Ave
- 942 Bridge Rd
- 49 Pine Brook Curve
- 49 Pine Brook Curve
- 49 Pine Brook Curve Unit 2
- 49 Pine Brook Curve Unit 1