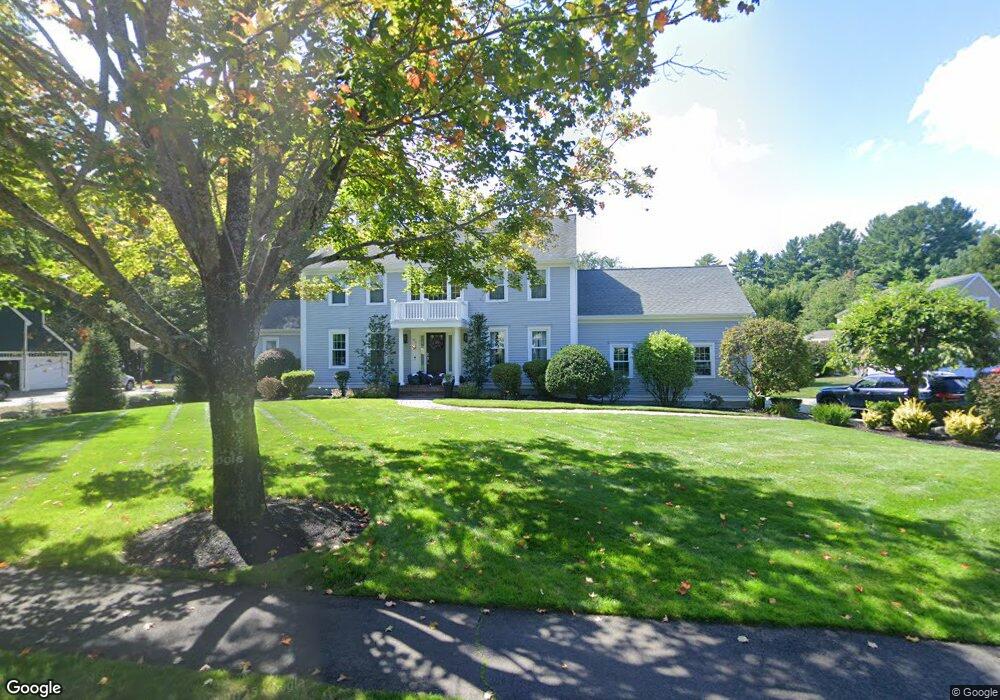
23 Push Cart Ln Hanover, MA 02339
Estimated Value: $1,147,000 - $1,380,000
4
Beds
3
Baths
2,528
Sq Ft
$495/Sq Ft
Est. Value
About This Home
This home is located at 23 Push Cart Ln, Hanover, MA 02339 and is currently estimated at $1,251,810, approximately $495 per square foot. 23 Push Cart Ln is a home located in Plymouth County with nearby schools including Hanover High School, South Shore Charter Public School, and Norwell KinderCare.
Ownership History
Date
Name
Owned For
Owner Type
Purchase Details
Closed on
Oct 16, 2013
Sold by
Folk James M and Folk Carol A
Bought by
Demong Nicole L
Current Estimated Value
Home Financials for this Owner
Home Financials are based on the most recent Mortgage that was taken out on this home.
Original Mortgage
$417,000
Outstanding Balance
$314,314
Interest Rate
4.58%
Mortgage Type
New Conventional
Estimated Equity
$937,496
Purchase Details
Closed on
Aug 27, 2004
Sold by
Chrisom Brian M and Chrisom Kathleen F
Bought by
Folk James M and Folk Carol A
Purchase Details
Closed on
Jan 8, 1998
Sold by
Paul D Spiro Co Inc
Bought by
Chrisom Brian M and Chrisom Kathleen F
Purchase Details
Closed on
Aug 13, 1997
Sold by
Cns Devel Corp
Bought by
Paul D Spiro Co Inc
Create a Home Valuation Report for This Property
The Home Valuation Report is an in-depth analysis detailing your home's value as well as a comparison with similar homes in the area
Home Values in the Area
Average Home Value in this Area
Purchase History
| Date | Buyer | Sale Price | Title Company |
|---|---|---|---|
| Demong Nicole L | $715,000 | -- | |
| Folk James M | $750,000 | -- | |
| Chrisom Brian M | $308,255 | -- | |
| Paul D Spiro Co Inc | $80,000 | -- |
Source: Public Records
Mortgage History
| Date | Status | Borrower | Loan Amount |
|---|---|---|---|
| Open | Demong Nicole L | $417,000 | |
| Closed | Demong Nicole L | $100,000 | |
| Previous Owner | Paul D Spiro Co Inc | $50,000 | |
| Previous Owner | Paul D Spiro Co Inc | $389,000 |
Source: Public Records
Tax History Compared to Growth
Tax History
| Year | Tax Paid | Tax Assessment Tax Assessment Total Assessment is a certain percentage of the fair market value that is determined by local assessors to be the total taxable value of land and additions on the property. | Land | Improvement |
|---|---|---|---|---|
| 2025 | $13,522 | $1,094,900 | $326,300 | $768,600 |
| 2024 | $13,148 | $1,024,000 | $326,300 | $697,700 |
| 2023 | $12,624 | $935,800 | $296,600 | $639,200 |
| 2022 | $13,170 | $863,600 | $259,700 | $603,900 |
| 2021 | $11,509 | $704,800 | $236,300 | $468,500 |
| 2020 | $11,156 | $684,000 | $236,300 | $447,700 |
| 2019 | $10,931 | $666,100 | $247,500 | $418,600 |
| 2018 | $10,338 | $635,000 | $258,700 | $376,300 |
| 2017 | $10,409 | $630,100 | $256,500 | $373,600 |
| 2016 | $10,089 | $598,400 | $233,300 | $365,100 |
| 2015 | $9,664 | $598,400 | $233,300 | $365,100 |
Source: Public Records
Map
Nearby Homes
- 1239 Main St
- 80 Coolidge Rd
- 375 Webster St
- 70 Dillingham Way
- 3 Blueberry Ct
- 118 Bates Way
- 214 Washington St Unit 24
- 214 Washington St Unit 28
- 120 Deerfield Ln
- 141 Deerfield Ln
- 18 Colby St
- 55 Turner Rd
- 62 High St
- 276 Woodland Dr
- 216 Whiting St
- 7 Assinippi Ave Unit 306
- 53 Chestnut St
- 206-208 Hinghm St
- 18 Midfield Dr
- 225 Prospect St
- 72 Beckford Farm Rd
- 35 Push Cart Ln
- 24 Push Cart Ln
- 6 Push Cart Ln
- 80 Beckford Farm Rd
- 40 Push Cart Ln
- 65 Beckford Farm Rd
- 77 Beckford Farm Rd
- 56 Push Cart Ln
- 51 Push Cart Ln
- 49 Beckford Farm Rd
- 19 Pumpkin Patch Way
- 34 Beckford Farm Rd
- 65 Autumn Ln
- 37 Beckford Farm Rd
- 70 Push Cart Ln
- 25 Pumpkin Patch Way
- 8 Pumpkin Patch Way
- 78 Autumn Ln
- 22 Autumn Ln