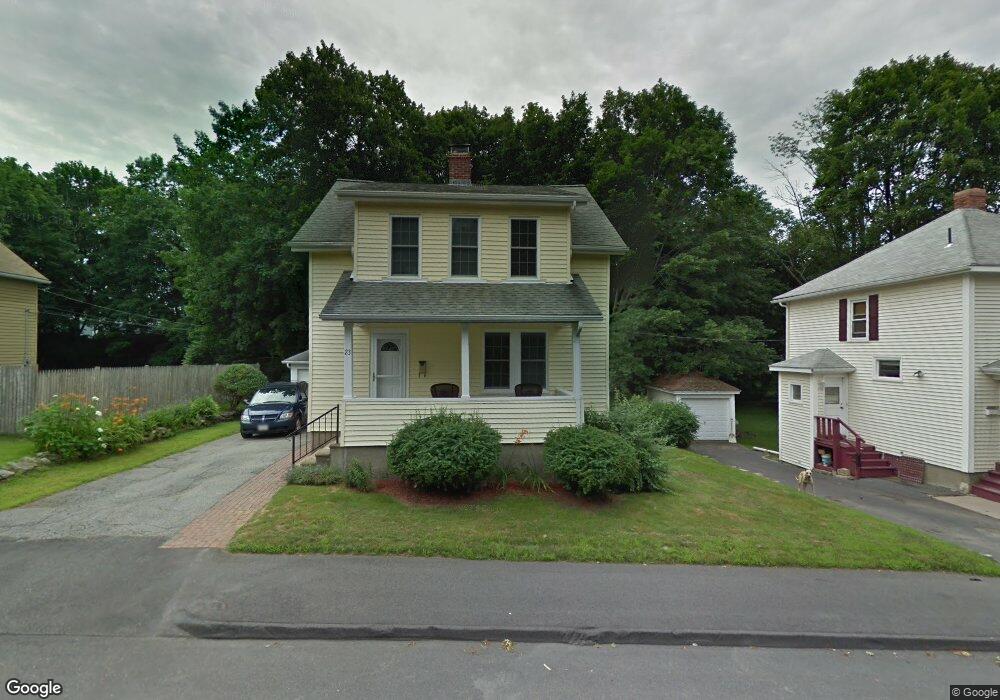
23 Rankin St Worcester, MA 01605
Brittan Square NeighborhoodEstimated Value: $377,440 - $402,000
3
Beds
1
Bath
1,350
Sq Ft
$291/Sq Ft
Est. Value
About This Home
This home is located at 23 Rankin St, Worcester, MA 01605 and is currently estimated at $393,360, approximately $291 per square foot. 23 Rankin St is a home located in Worcester County with nearby schools including Jacob Hiatt Magnet School, Chandler Magnet, and Wawecus Road School.
Ownership History
Date
Name
Owned For
Owner Type
Purchase Details
Closed on
Apr 30, 2009
Sold by
Dwyer William J
Bought by
Tambosi Vanessa L
Current Estimated Value
Home Financials for this Owner
Home Financials are based on the most recent Mortgage that was taken out on this home.
Original Mortgage
$134,518
Outstanding Balance
$85,037
Interest Rate
4.86%
Mortgage Type
Purchase Money Mortgage
Estimated Equity
$308,323
Create a Home Valuation Report for This Property
The Home Valuation Report is an in-depth analysis detailing your home's value as well as a comparison with similar homes in the area
Home Values in the Area
Average Home Value in this Area
Purchase History
| Date | Buyer | Sale Price | Title Company |
|---|---|---|---|
| Tambosi Vanessa L | $137,000 | -- |
Source: Public Records
Mortgage History
| Date | Status | Borrower | Loan Amount |
|---|---|---|---|
| Open | Tambosi Vanessa L | $134,518 |
Source: Public Records
Tax History
| Year | Tax Paid | Tax Assessment Tax Assessment Total Assessment is a certain percentage of the fair market value that is determined by local assessors to be the total taxable value of land and additions on the property. | Land | Improvement |
|---|---|---|---|---|
| 2025 | $4,163 | $315,600 | $78,700 | $236,900 |
| 2024 | $3,966 | $288,400 | $78,700 | $209,700 |
| 2023 | $3,827 | $266,900 | $68,400 | $198,500 |
| 2022 | $3,550 | $233,400 | $54,700 | $178,700 |
| 2021 | $3,440 | $211,300 | $43,800 | $167,500 |
| 2020 | $3,257 | $191,600 | $43,500 | $148,100 |
| 2019 | $3,116 | $173,100 | $38,000 | $135,100 |
| 2018 | $3,099 | $163,900 | $38,000 | $125,900 |
| 2017 | $2,958 | $153,900 | $38,000 | $115,900 |
| 2016 | $2,976 | $144,400 | $27,500 | $116,900 |
| 2015 | $2,898 | $144,400 | $27,500 | $116,900 |
| 2014 | $2,822 | $144,400 | $27,500 | $116,900 |
Source: Public Records
Map
Nearby Homes
- 6 Ashburnham Rd
- 30 Melrose St
- 5 Wakefield St
- 27 Harlow St
- 2 Selden St
- 33 Denmark St
- 25 Mckinley Rd
- 20B Edgeworth St
- 74 Green Hill Pkwy
- 78 Green Hill Pkwy
- 82 Green Hill Pkwy
- 176 Lincoln St Unit 4
- 26 Orne St
- 10 Dryden St Unit 7
- 3 Perkins St
- 110 Beverly Rd
- 139 Lincoln St
- 15 Boardman St
- 31 Boardman St
- 45 Goldthwaite Rd
Your Personal Tour Guide
Ask me questions while you tour the home.