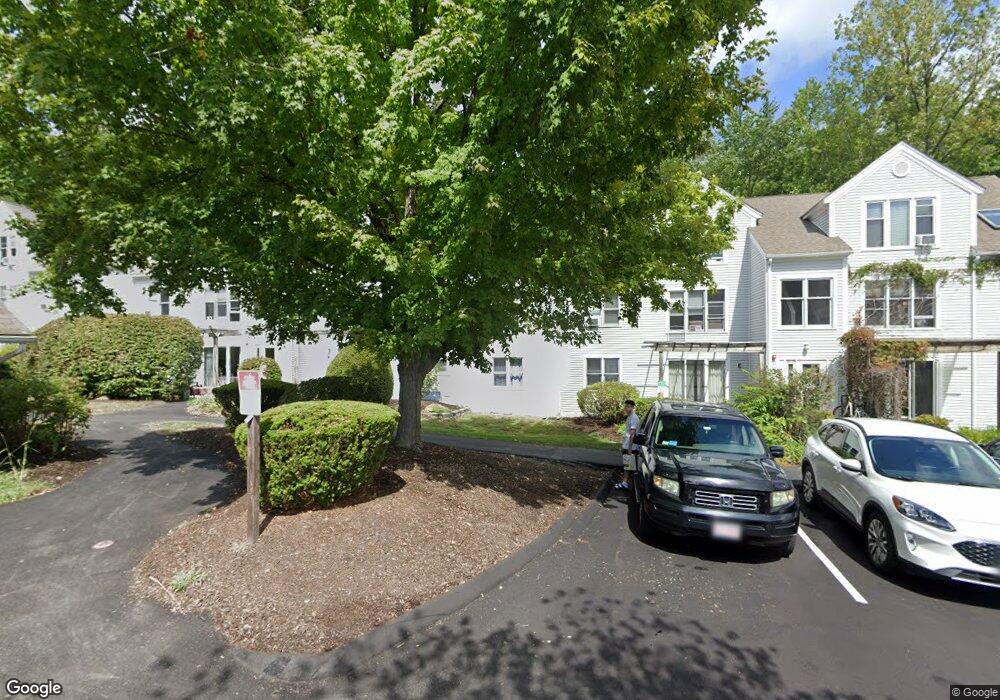
23 Salem Place Amherst, MA 01002
Estimated Value: $249,000 - $280,000
3
Beds
2
Baths
832
Sq Ft
$319/Sq Ft
Est. Value
About This Home
This home is located at 23 Salem Place, Amherst, MA 01002 and is currently estimated at $265,688, approximately $319 per square foot. 23 Salem Place is a home located in Hampshire County with nearby schools including Fort River Elementary School, Amherst Regional Middle School, and Amherst Regional High School.
Ownership History
Date
Name
Owned For
Owner Type
Purchase Details
Closed on
May 7, 2010
Sold by
Klayman Daniel Budd and Klayman Naomi Jean
Bought by
Sandler Steven J and Sandler Teresa M
Current Estimated Value
Home Financials for this Owner
Home Financials are based on the most recent Mortgage that was taken out on this home.
Original Mortgage
$100,000
Outstanding Balance
$66,960
Interest Rate
5.03%
Mortgage Type
Purchase Money Mortgage
Estimated Equity
$198,728
Purchase Details
Closed on
Jan 28, 2005
Sold by
Klayman Alice B
Bought by
Klayman Daniel Budd and Klayman Judith Ann
Purchase Details
Closed on
Jul 30, 2002
Sold by
Huntley Nancy L and Stapleton William T
Bought by
Klayman Alice
Home Financials for this Owner
Home Financials are based on the most recent Mortgage that was taken out on this home.
Original Mortgage
$103,200
Interest Rate
6.73%
Mortgage Type
Purchase Money Mortgage
Create a Home Valuation Report for This Property
The Home Valuation Report is an in-depth analysis detailing your home's value as well as a comparison with similar homes in the area
Home Values in the Area
Average Home Value in this Area
Purchase History
| Date | Buyer | Sale Price | Title Company |
|---|---|---|---|
| Sandler Steven J | $150,000 | -- | |
| Klayman Daniel Budd | -- | -- | |
| Klayman Alice | $129,000 | -- |
Source: Public Records
Mortgage History
| Date | Status | Borrower | Loan Amount |
|---|---|---|---|
| Open | Sandler Steven J | $100,000 | |
| Previous Owner | Klayman Alice | $103,200 | |
| Previous Owner | Klayman Alice | $84,000 |
Source: Public Records
Tax History Compared to Growth
Tax History
| Year | Tax Paid | Tax Assessment Tax Assessment Total Assessment is a certain percentage of the fair market value that is determined by local assessors to be the total taxable value of land and additions on the property. | Land | Improvement |
|---|---|---|---|---|
| 2025 | $42 | $231,500 | $0 | $231,500 |
| 2024 | $3,567 | $192,700 | $0 | $192,700 |
| 2023 | $3,773 | $187,700 | $0 | $187,700 |
| 2022 | $3,580 | $168,300 | $0 | $168,300 |
| 2021 | $3,415 | $156,500 | $0 | $156,500 |
| 2020 | $3,337 | $156,500 | $0 | $156,500 |
| 2019 | $3,187 | $146,200 | $0 | $146,200 |
| 2018 | $3,091 | $146,200 | $0 | $146,200 |
| 2017 | $3,168 | $145,100 | $0 | $145,100 |
| 2016 | $3,079 | $145,100 | $0 | $145,100 |
| 2015 | $2,980 | $145,100 | $0 | $145,100 |
Source: Public Records
Map
Nearby Homes
- 48 Gray St
- 0 Red Gate Ln Unit 73348273
- 161 Chestnut St
- 305 Strong St
- 18 N Prospect St
- 65 N Prospect St
- 265 Stanley St
- 0 Heatherstone Rd
- 14 Pebble Ridge Rd
- 9 Harkness Rd
- 96 Logtown Rd
- 53 Pine Grove Unit 53
- 61 S Valley Rd
- 481 Old Farm Rd
- 11 Sheerman Ln
- 57 Tanglewood Rd
- 185 Cherry Ln
- 26 Greenleaves Dr Unit 620
- 88 Farview Way
- 13 Harlow Dr
- 37 Salem Place
- 33 Salem Place
- 25 Salem Place
- 24 Salem Place
- 22 Salem Place
- 21 Salem Place
- 18 Salem Place
- 35 Salem Place
- 31 Salem Place
- 30 Salem Place
- 28 Salem Place
- 26 Salem Place
- 19 Salem Place
- 17 Salem Place
- 31 Salem Place Unit 31
- 35 Salem Place Unit 35
- 41 Salem Place
- 40 Salem Place
- 39 Salem Place
- 39 Salem Place Unit 39