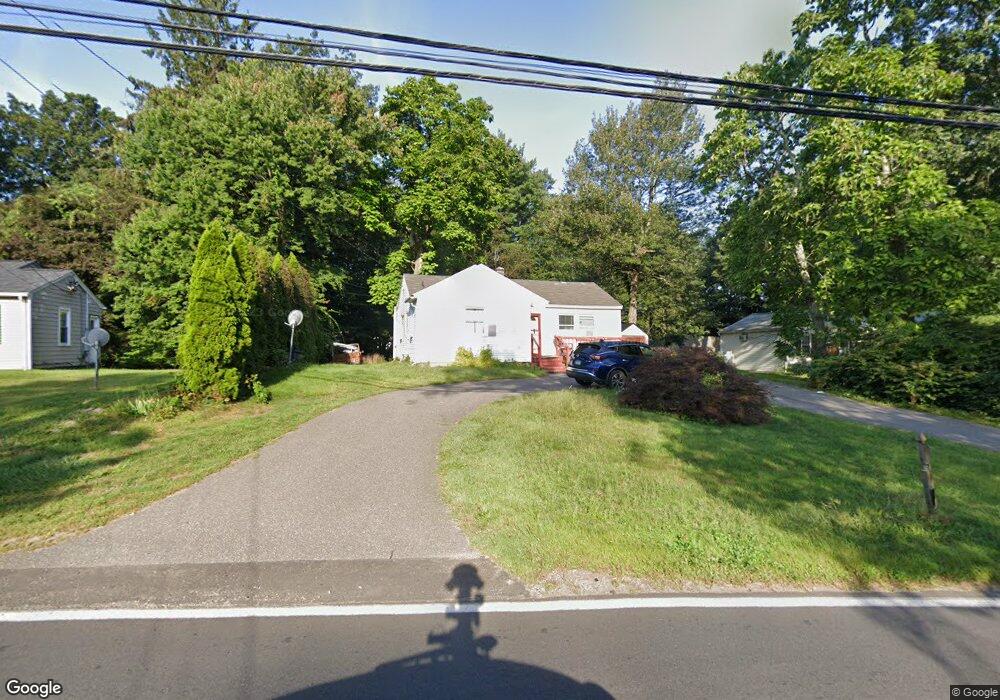
23 Scott Rd Prospect, CT 06712
Estimated Value: $331,000 - $369,000
3
Beds
2
Baths
1,516
Sq Ft
$231/Sq Ft
Est. Value
About This Home
This home is located at 23 Scott Rd, Prospect, CT 06712 and is currently estimated at $349,519, approximately $230 per square foot. 23 Scott Rd is a home located in New Haven County with nearby schools including Prospect Elementary School, Long River Middle School, and Woodland Regional High School.
Ownership History
Date
Name
Owned For
Owner Type
Purchase Details
Closed on
Jan 11, 1999
Sold by
Slapikas Jeffrey B and Slapikas Kimberly A
Bought by
Primus Doris A
Current Estimated Value
Purchase Details
Closed on
Mar 10, 1998
Sold by
Maker Arlene R Est
Bought by
Slapikas Jeffrey B and Slapikas Kimberly A
Create a Home Valuation Report for This Property
The Home Valuation Report is an in-depth analysis detailing your home's value as well as a comparison with similar homes in the area
Home Values in the Area
Average Home Value in this Area
Purchase History
| Date | Buyer | Sale Price | Title Company |
|---|---|---|---|
| Primus Doris A | $94,500 | -- | |
| Slapikas Jeffrey B | $51,000 | -- |
Source: Public Records
Mortgage History
| Date | Status | Borrower | Loan Amount |
|---|---|---|---|
| Open | Slapikas Jeffrey B | $193,852 | |
| Closed | Slapikas Jeffrey B | $36,841 | |
| Closed | Slapikas Jeffrey B | $124,200 | |
| Closed | Slapikas Jeffrey B | $86,912 |
Source: Public Records
Tax History
| Year | Tax Paid | Tax Assessment Tax Assessment Total Assessment is a certain percentage of the fair market value that is determined by local assessors to be the total taxable value of land and additions on the property. | Land | Improvement |
|---|---|---|---|---|
| 2025 | $4,856 | $189,910 | $62,650 | $127,260 |
| 2024 | $4,132 | $128,550 | $62,660 | $65,890 |
| 2023 | $4,103 | $128,550 | $62,660 | $65,890 |
| 2022 | $4,107 | $128,550 | $62,660 | $65,890 |
| 2021 | $3,327 | $103,000 | $62,660 | $40,340 |
| 2020 | $3,078 | $97,390 | $62,660 | $34,730 |
| 2019 | $3,014 | $97,390 | $62,660 | $34,730 |
| 2018 | $3,019 | $97,390 | $62,660 | $34,730 |
| 2017 | $3,043 | $97,390 | $62,660 | $34,730 |
| 2016 | $2,913 | $97,390 | $62,660 | $34,730 |
| 2015 | $3,249 | $111,140 | $62,660 | $48,480 |
| 2014 | $3,221 | $111,140 | $62,660 | $48,480 |
Source: Public Records
Map
Nearby Homes
Your Personal Tour Guide
Ask me questions while you tour the home.