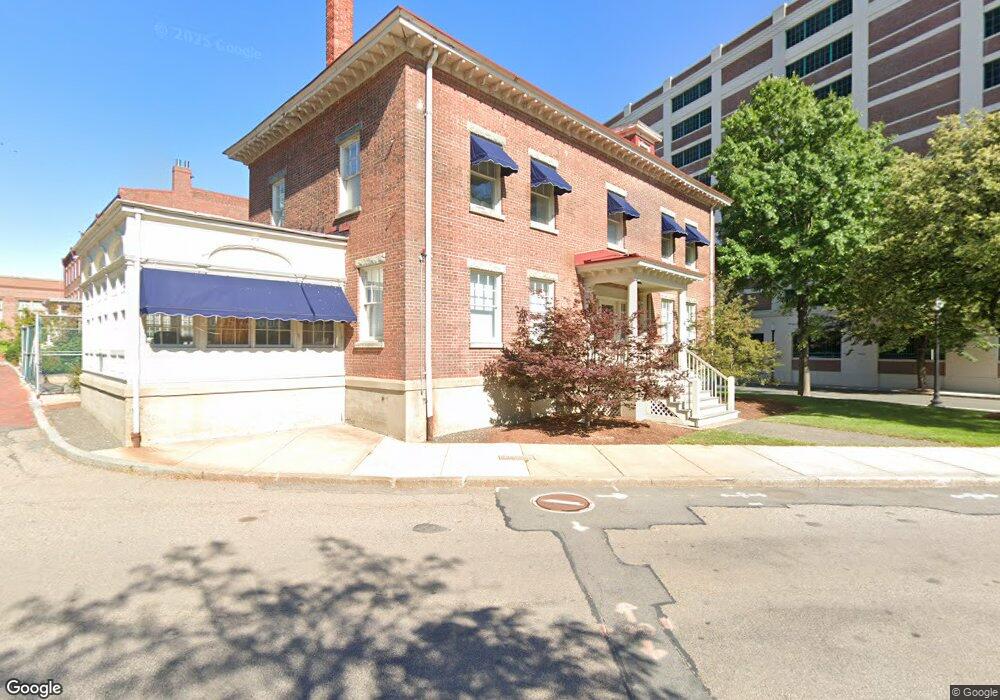
23 Shipway Place Charlestown, MA 02129
Thompson Square-Bunker Hill NeighborhoodEstimated Value: $1,402,000 - $1,949,000
2
Beds
3
Baths
1,958
Sq Ft
$835/Sq Ft
Est. Value
About This Home
This home is located at 23 Shipway Place, Charlestown, MA 02129 and is currently estimated at $1,634,010, approximately $834 per square foot. 23 Shipway Place is a home located in Suffolk County with nearby schools including Boston Children's School and St John School.
Ownership History
Date
Name
Owned For
Owner Type
Purchase Details
Closed on
Apr 26, 1999
Sold by
Byrne Samuel T
Bought by
Tegfledt Jennifer S
Current Estimated Value
Purchase Details
Closed on
Oct 30, 1992
Sold by
Crowley Dennis
Bought by
Byrne Samuel T
Create a Home Valuation Report for This Property
The Home Valuation Report is an in-depth analysis detailing your home's value as well as a comparison with similar homes in the area
Home Values in the Area
Average Home Value in this Area
Purchase History
| Date | Buyer | Sale Price | Title Company |
|---|---|---|---|
| Tegfledt Jennifer S | $505,000 | -- | |
| Tegfledt Jennifer S | $505,000 | -- | |
| Byrne Samuel T | $260,000 | -- | |
| Byrne Samuel T | $260,000 | -- |
Source: Public Records
Mortgage History
| Date | Status | Borrower | Loan Amount |
|---|---|---|---|
| Open | Byrne Samuel T | $389,000 | |
| Previous Owner | Byrne Samuel T | $285,000 | |
| Previous Owner | Byrne Samuel T | $60,000 |
Source: Public Records
Tax History Compared to Growth
Tax History
| Year | Tax Paid | Tax Assessment Tax Assessment Total Assessment is a certain percentage of the fair market value that is determined by local assessors to be the total taxable value of land and additions on the property. | Land | Improvement |
|---|---|---|---|---|
| 2025 | $16,121 | $1,392,100 | $0 | $1,392,100 |
| 2024 | $14,589 | $1,338,400 | $0 | $1,338,400 |
| 2023 | $13,689 | $1,274,600 | $0 | $1,274,600 |
| 2022 | $14,109 | $1,296,800 | $0 | $1,296,800 |
| 2021 | $13,837 | $1,296,800 | $0 | $1,296,800 |
| 2020 | $12,573 | $1,190,600 | $0 | $1,190,600 |
| 2019 | $12,302 | $1,167,200 | $0 | $1,167,200 |
| 2018 | $11,651 | $1,111,700 | $0 | $1,111,700 |
| 2017 | $11,325 | $1,069,400 | $0 | $1,069,400 |
| 2016 | $11,097 | $1,008,800 | $0 | $1,008,800 |
| 2015 | $10,802 | $892,000 | $0 | $892,000 |
| 2014 | $11,006 | $874,900 | $0 | $874,900 |
Source: Public Records
Map
Nearby Homes
- 106 13th St Unit 204
- 42 8th St Unit 5316
- 42 8th St Unit 4209
- 42 8th St Unit 4106
- 42 8th St Unit 1201
- 42 8th St Unit 3306
- 42 8th St Unit 2302
- 197 8th St Unit 501
- 197 Eighth St Unit 628
- 197 Eighth St Unit 212
- 106 Bunker Hill St Unit 2
- 106 Bunker Hill St Unit 6
- 106 Bunker Hill St Unit 1
- 106 Bunker Hill St Unit 4P
- 106 Bunker Hill St Unit 3
- 73 Chelsea St Unit 401
- 5 Wallace Ct
- 275 Border St Unit 302
- 605 Plan at Mira
- 301 Border St Unit 511
- 1 Shipway Place
- 1 Shipway Place Unit C-1
- 1 Shipway Place Unit 1
- 47 Shipway Place
- 43 Shipway Place
- 41 Shipway Place
- 39 Shipway Place
- 37 Shipway Place
- 35 Shipway Place
- 33 Shipway Place
- 31 Shipway Place
- 27 Shipway Place
- 25 Shipway Place
- 13 Shipway Place
- 13 Shipway Place
- 47 Shipway Place Unit 47
- 13 Shipway Place Unit 13
- 9 Shipway Place Unit c-9
- 9 Shipway Place
- 9 Shipway Place Unit 9