K
Seller's Agent in 2022
Kevin Lewis
Coldwell Banker Realty - Hingham
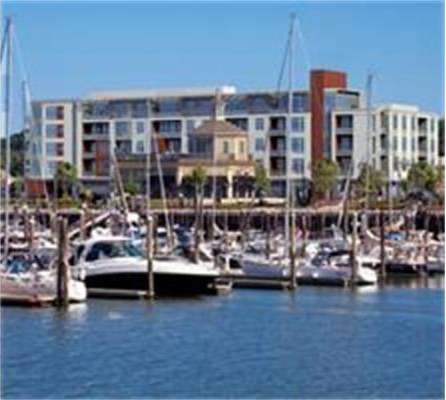
Hingham's newest waterfront condominium community, The Moorings, conveys tasteful, quality condominium living with ocean views, balconies,and sophisticated interior finishes. Choose from 7 designs all providing open floor plans - 1,2,or 2+ bedrooms. The Moorings located adjacent to The Launch, Hingham's latest shopping and dining Destination. Pre-construction pricing now available.
Home Type
Condominium
Est. Annual Taxes
$11,667
Year Built
2011
Lot Details
0
| Date | Type | Sale Price | Title Company |
|---|---|---|---|
| Not Resolvable | $1,075,000 | None Available | |
| Not Resolvable | $1,025,000 | None Available | |
| Not Resolvable | $957,750 | -- | |
| Deed | $711,550 | -- |
| Date | Status | Loan Amount | Loan Type |
|---|---|---|---|
| Open | $967,500 | Purchase Money Mortgage | |
| Previous Owner | $478,875 | New Conventional |
| Date | Event | Price | Change | Sq Ft Price |
|---|---|---|---|---|
| 03/21/2022 03/21/22 | Sold | $1,075,000 | 0.0% | $691 / Sq Ft |
| 02/08/2022 02/08/22 | Pending | -- | -- | -- |
| 12/21/2021 12/21/21 | Off Market | $1,075,000 | -- | -- |
| 10/25/2021 10/25/21 | For Sale | $1,125,000 | +9.8% | $723 / Sq Ft |
| 03/31/2021 03/31/21 | Sold | $1,025,000 | -2.3% | $659 / Sq Ft |
| 02/22/2021 02/22/21 | Pending | -- | -- | -- |
| 02/11/2021 02/11/21 | For Sale | $1,049,000 | +9.5% | $674 / Sq Ft |
| 07/18/2017 07/18/17 | Sold | $957,750 | -2.2% | $616 / Sq Ft |
| 06/05/2017 06/05/17 | Pending | -- | -- | -- |
| 05/04/2017 05/04/17 | For Sale | $979,500 | +37.7% | $629 / Sq Ft |
| 11/05/2012 11/05/12 | Sold | $711,550 | 0.0% | $457 / Sq Ft |
| 11/05/2012 11/05/12 | For Sale | $711,550 | 0.0% | $457 / Sq Ft |
| 10/24/2012 10/24/12 | Sold | $711,550 | 0.0% | $457 / Sq Ft |
| 09/20/2012 09/20/12 | Off Market | $711,550 | -- | -- |
| 03/07/2012 03/07/12 | For Sale | $725,000 | -- | $466 / Sq Ft |
| Year | Tax Paid | Tax Assessment Tax Assessment Total Assessment is a certain percentage of the fair market value that is determined by local assessors to be the total taxable value of land and additions on the property. | Land | Improvement |
|---|---|---|---|---|
| 2025 | $11,667 | $1,091,400 | $0 | $1,091,400 |
| 2024 | $11,176 | $1,030,000 | $0 | $1,030,000 |
| 2023 | $9,780 | $978,000 | $0 | $978,000 |
| 2022 | $10,128 | $876,100 | $0 | $876,100 |
| 2021 | $10,788 | $914,200 | $0 | $914,200 |
| 2020 | $10,541 | $914,200 | $0 | $914,200 |
| 2019 | $10,797 | $914,200 | $0 | $914,200 |
| 2018 | $9,633 | $818,400 | $0 | $818,400 |
| 2017 | $9,189 | $750,100 | $0 | $750,100 |
| 2016 | $8,724 | $698,500 | $0 | $698,500 |
| 2015 | $8,637 | $689,300 | $0 | $689,300 |
K
Seller's Agent in 2022
Kevin Lewis
Coldwell Banker Realty - Hingham

Buyer's Agent in 2022
Stone Prum
Corcoran Property Advisors
(339) 532-9329
1 in this area
51 Total Sales
Seller's Agent in 2021
Maureen Doran
Coldwell Banker Realty - Hingham
(617) 680-2300
11 in this area
69 Total Sales
Seller Co-Listing Agent in 2021
Molly Hall
Coldwell Banker Realty - Hingham
(617) 571-2007
10 in this area
70 Total Sales
Seller's Agent in 2017
Charlene Levi
TLC Real Estate
(781) 789-2671
31 in this area
61 Total Sales
Buyer's Agent in 2017
Marc DeNoia
RE/MAX Real Estate Center
(617) 970-5447
19 Total Sales
Source: MLS Property Information Network (MLS PIN)
MLS Number: 71347817
APN: HING-000035-000207-000052
Disclaimer: Certain information contained herein is derived from information provided by parties other than Homes.com. All information provided is deemed reliable, but is not guaranteed to be accurate and should be independently verified.
![]() The property listing data and information, or the Images, set forth herein were provided to MLS Property Information Network, Inc. from third party sources, including sellers, lessors and public records, and were compiled by MLS Property Information Network, Inc. The property listing data and information, and the Images, are for the personal, non-commercial use of consumers having a good faith interest in purchasing or leasing listed properties of the type displayed to them and may not be used for any purpose other than to identify prospective properties which such consumers may have a good faith interest in purchasing or leasing. MLS Property Information Network, Inc. and its subscribers disclaim any and all representations and warranties as to the accuracy of the property listing data and information, or as to the accuracy of any of the Images, set forth herein.
The property listing data and information, or the Images, set forth herein were provided to MLS Property Information Network, Inc. from third party sources, including sellers, lessors and public records, and were compiled by MLS Property Information Network, Inc. The property listing data and information, and the Images, are for the personal, non-commercial use of consumers having a good faith interest in purchasing or leasing listed properties of the type displayed to them and may not be used for any purpose other than to identify prospective properties which such consumers may have a good faith interest in purchasing or leasing. MLS Property Information Network, Inc. and its subscribers disclaim any and all representations and warranties as to the accuracy of the property listing data and information, or as to the accuracy of any of the Images, set forth herein.