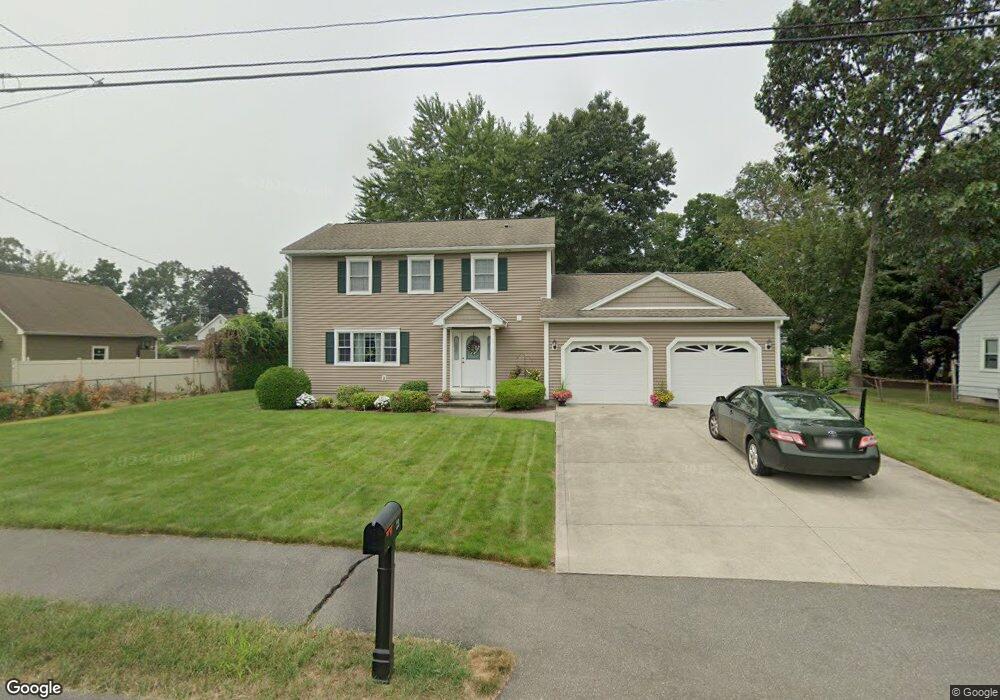
23 Simonds St Ludlow, MA 01056
Estimated Value: $388,000 - $437,000
3
Beds
3
Baths
1,536
Sq Ft
$269/Sq Ft
Est. Value
About This Home
This home is located at 23 Simonds St, Ludlow, MA 01056 and is currently estimated at $412,868, approximately $268 per square foot. 23 Simonds St is a home located in Hampden County with nearby schools including East Street Elementary School, Chapin Street Elementary School, and Paul R. Baird Middle School.
Ownership History
Date
Name
Owned For
Owner Type
Purchase Details
Closed on
Jun 14, 2002
Sold by
Pires Antonio and Pires Christine H
Bought by
Alves Maria F
Current Estimated Value
Home Financials for this Owner
Home Financials are based on the most recent Mortgage that was taken out on this home.
Original Mortgage
$90,000
Outstanding Balance
$37,282
Interest Rate
6.8%
Mortgage Type
Purchase Money Mortgage
Estimated Equity
$375,586
Create a Home Valuation Report for This Property
The Home Valuation Report is an in-depth analysis detailing your home's value as well as a comparison with similar homes in the area
Home Values in the Area
Average Home Value in this Area
Purchase History
| Date | Buyer | Sale Price | Title Company |
|---|---|---|---|
| Alves Maria F | $130,000 | -- | |
| Alves Maria F | $130,000 | -- |
Source: Public Records
Mortgage History
| Date | Status | Borrower | Loan Amount |
|---|---|---|---|
| Open | Alves Maria F | $90,000 | |
| Closed | Alves Maria F | $90,000 |
Source: Public Records
Tax History
| Year | Tax Paid | Tax Assessment Tax Assessment Total Assessment is a certain percentage of the fair market value that is determined by local assessors to be the total taxable value of land and additions on the property. | Land | Improvement |
|---|---|---|---|---|
| 2025 | $6,345 | $365,700 | $85,100 | $280,600 |
| 2024 | $6,136 | $339,200 | $85,100 | $254,100 |
| 2023 | $6,023 | $308,700 | $77,900 | $230,800 |
| 2022 | $5,349 | $267,600 | $71,400 | $196,200 |
| 2021 | $5,373 | $254,900 | $71,400 | $183,500 |
| 2020 | $5,145 | $249,500 | $70,300 | $179,200 |
| 2019 | $4,842 | $244,300 | $69,700 | $174,600 |
| 2018 | $4,519 | $237,700 | $69,700 | $168,000 |
| 2017 | $4,384 | $236,600 | $68,300 | $168,300 |
| 2016 | $4,342 | $239,500 | $66,900 | $172,600 |
| 2015 | $4,105 | $237,400 | $66,200 | $171,200 |
Source: Public Records
Map
Nearby Homes
- 57 Belmont St
- Lot 602 Grandview Ave
- 0 Fuller St Unit 73409741
- 70 Fuller St
- 98 Fuller St Unit 32
- 350 West Ave Unit 5
- 119 Blisswood Village Dr
- 14 Arthur St
- 39 Rogers Ave
- 0 N S Main St Io
- 295 Main St
- 201 Main St
- 166-168 Main St
- 42 Loopley St
- 46-48 Milton St
- 382 Holyoke St
- 26 Swan Ave
- 96 Lyons St
- 102 Swan Ave
- 0 Center St Unit 73415933
Your Personal Tour Guide
Ask me questions while you tour the home.