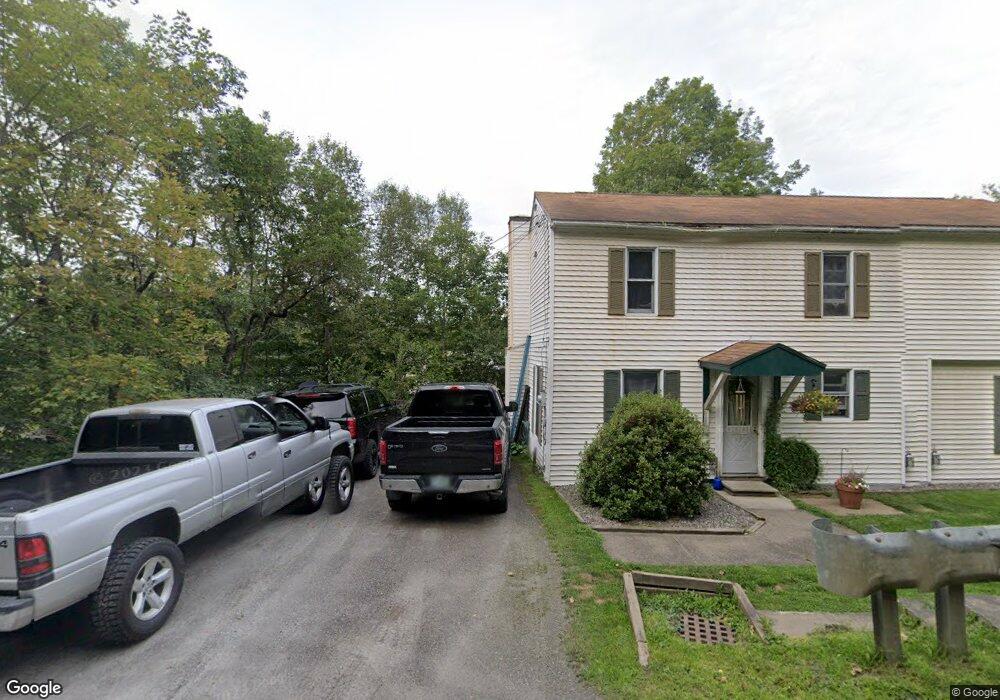
23 Spring St Colebrook, NH 03576
Estimated Value: $102,896 - $155,000
3
Beds
1
Bath
1,096
Sq Ft
$115/Sq Ft
Est. Value
About This Home
This home is located at 23 Spring St, Colebrook, NH 03576 and is currently estimated at $126,224, approximately $115 per square foot. 23 Spring St is a home located in Coos County with nearby schools including Colebrook Elementary School, Colebrook Academy, and Camp E-Toh-Anee.
Ownership History
Date
Name
Owned For
Owner Type
Purchase Details
Closed on
Nov 2, 2017
Sold by
Demers David E
Bought by
Maclaure Kenneth B
Current Estimated Value
Home Financials for this Owner
Home Financials are based on the most recent Mortgage that was taken out on this home.
Original Mortgage
$36,630
Outstanding Balance
$30,678
Interest Rate
3.83%
Mortgage Type
FHA
Estimated Equity
$95,546
Purchase Details
Closed on
Jul 6, 2006
Sold by
Elliott Douglas J
Bought by
Usa Va
Create a Home Valuation Report for This Property
The Home Valuation Report is an in-depth analysis detailing your home's value as well as a comparison with similar homes in the area
Purchase History
| Date | Buyer | Sale Price | Title Company |
|---|---|---|---|
| Maclaure Kenneth B | $40,000 | -- | |
| Usa Va | $52,600 | -- |
Source: Public Records
Mortgage History
| Date | Status | Borrower | Loan Amount |
|---|---|---|---|
| Open | Maclaure Kenneth B | $36,630 |
Source: Public Records
Tax History
| Year | Tax Paid | Tax Assessment Tax Assessment Total Assessment is a certain percentage of the fair market value that is determined by local assessors to be the total taxable value of land and additions on the property. | Land | Improvement |
|---|---|---|---|---|
| 2024 | $1,623 | $46,400 | $12,700 | $33,700 |
| 2023 | $1,469 | $46,400 | $12,700 | $33,700 |
| 2022 | $1,314 | $46,400 | $12,700 | $33,700 |
| 2021 | $1,360 | $46,400 | $12,700 | $33,700 |
| 2020 | $1,289 | $46,400 | $12,700 | $33,700 |
| 2019 | $1,398 | $46,400 | $12,700 | $33,700 |
| 2018 | $2,878 | $69,400 | $12,700 | $56,700 |
| 2017 | $2,047 | $69,400 | $12,700 | $56,700 |
| 2016 | $1,979 | $69,400 | $12,700 | $56,700 |
| 2015 | $2,005 | $69,400 | $12,700 | $56,700 |
| 2014 | $2,009 | $69,400 | $12,700 | $56,700 |
| 2013 | $1,767 | $76,600 | $14,500 | $62,100 |
Source: Public Records
Map
Nearby Homes
Your Personal Tour Guide
Ask me questions while you tour the home.