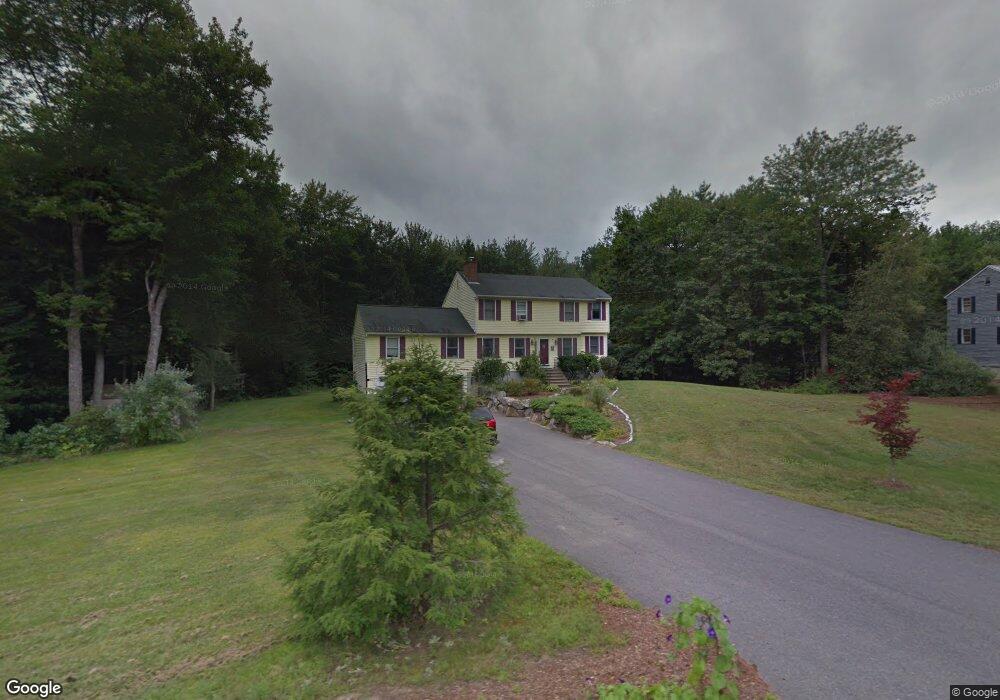
23 Stephanie Dr Bedford, NH 03110
Bedford NeighborhoodEstimated Value: $707,000 - $731,000
3
Beds
4
Baths
2,340
Sq Ft
$309/Sq Ft
Est. Value
About This Home
This home is located at 23 Stephanie Dr, Bedford, NH 03110 and is currently estimated at $722,385, approximately $308 per square foot. 23 Stephanie Dr is a home located in Hillsborough County with nearby schools including Mckelvie Intermediate School, Ross A. Lurgio Middle School, and Bedford High School.
Ownership History
Date
Name
Owned For
Owner Type
Purchase Details
Closed on
Sep 8, 2023
Sold by
Cordingley Kathryn M
Bought by
Kathryn Cordingley Ret and Cordingley
Current Estimated Value
Purchase Details
Closed on
Sep 22, 2017
Sold by
Olson Nancy C
Bought by
Cordingley Kathryn M
Purchase Details
Closed on
Jun 27, 2012
Sold by
Cordingley Katheryn M
Bought by
Cordingley Katheryn M
Home Financials for this Owner
Home Financials are based on the most recent Mortgage that was taken out on this home.
Original Mortgage
$330,736
Interest Rate
3.78%
Mortgage Type
New Conventional
Purchase Details
Closed on
May 10, 2006
Sold by
Sarah K Zink Lt
Bought by
Olson Richard E
Home Financials for this Owner
Home Financials are based on the most recent Mortgage that was taken out on this home.
Original Mortgage
$284,000
Interest Rate
6.4%
Mortgage Type
Purchase Money Mortgage
Purchase Details
Closed on
Oct 26, 1998
Sold by
Gladston Steele and Gladston Karen Lynn
Bought by
Zink Charles E and Zink Sarah K
Home Financials for this Owner
Home Financials are based on the most recent Mortgage that was taken out on this home.
Original Mortgage
$175,500
Interest Rate
6.74%
Mortgage Type
Purchase Money Mortgage
Create a Home Valuation Report for This Property
The Home Valuation Report is an in-depth analysis detailing your home's value as well as a comparison with similar homes in the area
Home Values in the Area
Average Home Value in this Area
Purchase History
| Date | Buyer | Sale Price | Title Company |
|---|---|---|---|
| Kathryn Cordingley Ret | -- | None Available | |
| Cordingley Kathryn M | -- | -- | |
| Cordingley Katheryn M | -- | -- | |
| Olson Richard E | $355,000 | -- | |
| Zink Charles E | $195,000 | -- |
Source: Public Records
Mortgage History
| Date | Status | Borrower | Loan Amount |
|---|---|---|---|
| Previous Owner | Cordingley Katheryn M | $330,736 | |
| Previous Owner | Zink Charles E | $285,200 | |
| Previous Owner | Zink Charles E | $10,138 | |
| Previous Owner | Zink Charles E | $284,000 | |
| Previous Owner | Zink Charles E | $175,500 |
Source: Public Records
Tax History Compared to Growth
Tax History
| Year | Tax Paid | Tax Assessment Tax Assessment Total Assessment is a certain percentage of the fair market value that is determined by local assessors to be the total taxable value of land and additions on the property. | Land | Improvement |
|---|---|---|---|---|
| 2024 | $10,313 | $652,300 | $261,700 | $390,600 |
| 2023 | $9,491 | $641,300 | $261,700 | $379,600 |
| 2022 | $8,631 | $490,400 | $193,900 | $296,500 |
| 2021 | $8,405 | $490,400 | $193,900 | $296,500 |
| 2020 | $8,168 | $408,000 | $142,000 | $266,000 |
| 2019 | $7,732 | $408,000 | $142,000 | $266,000 |
| 2018 | $7,762 | $380,500 | $142,000 | $238,500 |
| 2017 | $7,195 | $380,500 | $142,000 | $238,500 |
| 2016 | $7,384 | $330,100 | $113,300 | $216,800 |
| 2015 | $7,513 | $330,100 | $113,300 | $216,800 |
| 2014 | $7,427 | $330,100 | $113,300 | $216,800 |
| 2013 | $7,214 | $325,400 | $113,300 | $212,100 |
Source: Public Records
Map
Nearby Homes
- 197 Liberty Hill Rd
- 29 Pebble Beach Dr
- 15 Spyglass Point Cir
- 20 Pebble Beach Dr Unit 22-89-20
- 10 Barrington Dr
- 82 Pilgrim Dr
- 7 Hamilton Way
- 116 Nashua Rd
- 18 Horizon Dr
- 12 Knoll Crest Dr Unit Lot 5 - The Hannah
- 17-4-28 Boiling Kettle Way
- 17-4-28 Boiling Kettle Way Unit 28
- 20 Liberty Hill Rd
- 155 Wallace Rd
- 150 Wallace Rd
- 34 Chatham Dr
- 34 Briston Ct
- 80 Wendover Way
- 3 Churchill Ct Unit UN111
- 40 Seton Dr