Estimated Value: $268,000 - $329,000
3
Beds
1
Bath
1,010
Sq Ft
$293/Sq Ft
Est. Value
About This Home
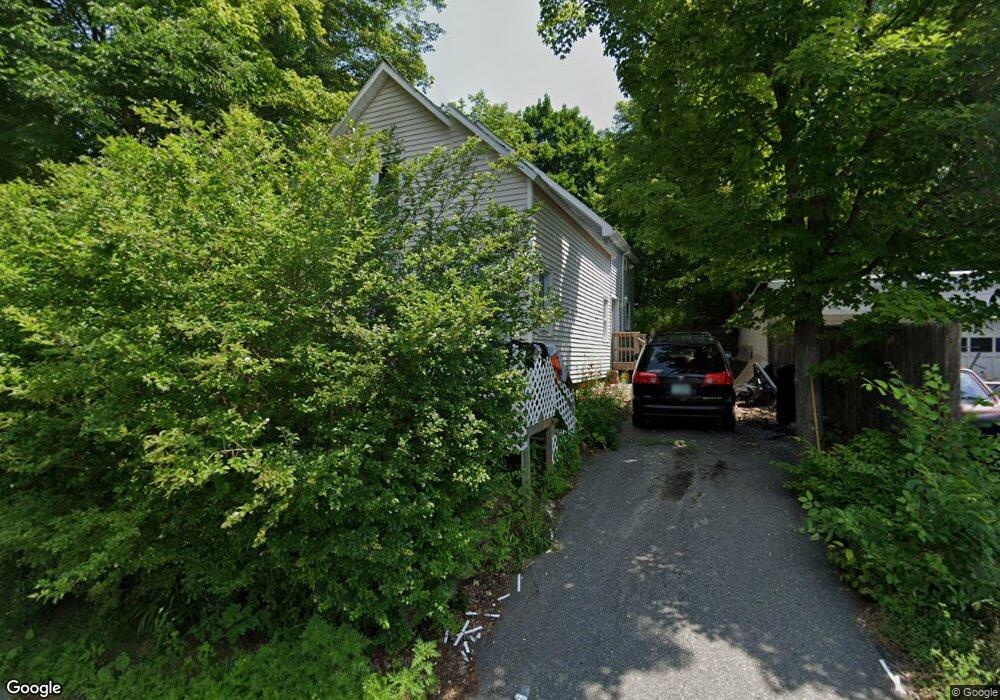
This home is located at 23 Sullivan St, Keene, NH 03431 and is currently estimated at $295,723, approximately $292 per square foot. 23 Sullivan St is a home located in Cheshire County with nearby schools including Greenlee Primary School, Keene Middle School, and Mayland Early College High School.
Ownership History
Date
Name
Owned For
Owner Type
Purchase Details
Closed on
Sep 10, 2012
Sold by
Quershi Aftb
Bought by
Ali Mohammed
Current Estimated Value
Purchase Details
Closed on
May 26, 2010
Sold by
Rowntree Dafna
Bought by
Td Bank Na
Purchase Details
Closed on
Jul 29, 2003
Sold by
Morrison Eric J
Bought by
Rowntree Dafna
Home Financials for this Owner
Home Financials are based on the most recent Mortgage that was taken out on this home.
Original Mortgage
$77,680
Interest Rate
5.27%
Create a Home Valuation Report for This Property
The Home Valuation Report is an in-depth analysis detailing your home's value as well as a comparison with similar homes in the area
Home Values in the Area
Average Home Value in this Area
Purchase History
| Date | Buyer | Sale Price | Title Company |
|---|---|---|---|
| Ali Mohammed | -- | -- | |
| Td Bank Na | $50,000 | -- | |
| Rowntree Dafna | $97,100 | -- |
Source: Public Records
Mortgage History
| Date | Status | Borrower | Loan Amount |
|---|---|---|---|
| Previous Owner | Rowntree Dafna | $77,680 |
Source: Public Records
Tax History Compared to Growth
Tax History
| Year | Tax Paid | Tax Assessment Tax Assessment Total Assessment is a certain percentage of the fair market value that is determined by local assessors to be the total taxable value of land and additions on the property. | Land | Improvement |
|---|---|---|---|---|
| 2024 | $5,645 | $170,700 | $27,800 | $142,900 |
| 2023 | $4,870 | $152,700 | $27,800 | $124,900 |
| 2022 | $4,738 | $152,700 | $27,800 | $124,900 |
| 2021 | $4,776 | $152,700 | $27,800 | $124,900 |
| 2020 | $4,269 | $114,500 | $32,300 | $82,200 |
| 2019 | $2,895 | $77,000 | $32,300 | $44,700 |
| 2018 | $3,237 | $87,200 | $32,300 | $54,900 |
| 2017 | $3,212 | $86,300 | $31,400 | $54,900 |
| 2016 | $3,140 | $86,300 | $31,400 | $54,900 |
Source: Public Records
Map
Nearby Homes
- 91 Sullivan St
- 49-51 Howard St
- 77 Franklin St
- 13 Brook St
- 17 Meetinghouse Rd
- 50 Forest St
- 67 Woodburn St
- 37 Church St Unit 3
- 22 Fairfield Ct
- 471 Chapman Rd
- 14 Foster St
- 15 Jennison St
- 57 Winchester St
- 194 Marlboro St
- 30 Dartmouth St
- 39 Windsor Ct Unit B
- 390 Main St
- 232 Winchester St
- 4 Middletown Rd
- 269 Branch Rd