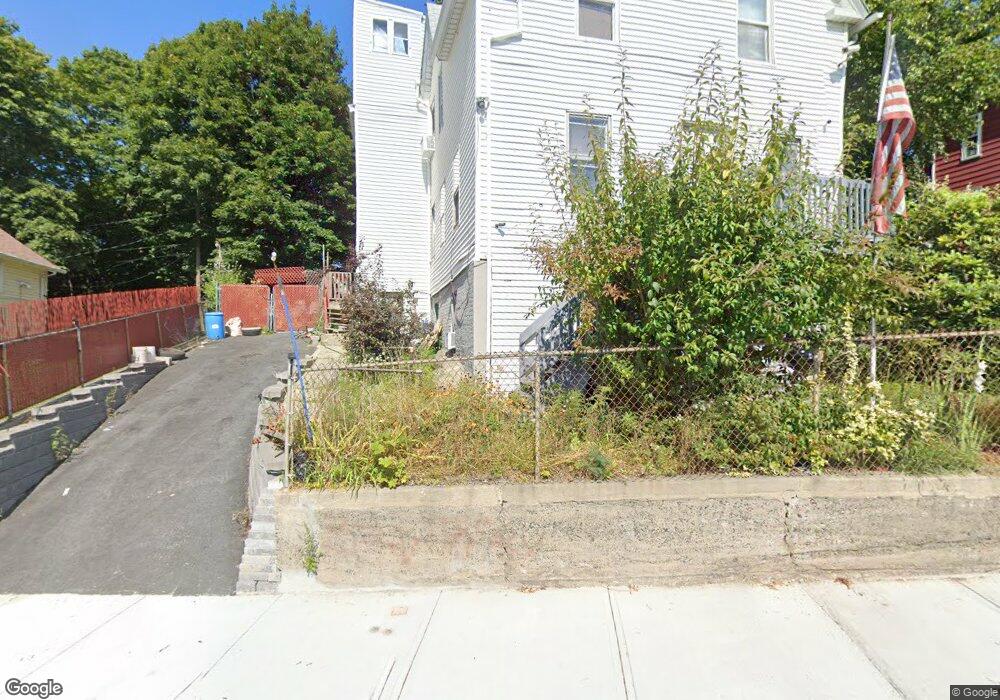
23 Thorne St Worcester, MA 01604
Franklin Plantation NeighborhoodEstimated Value: $471,000 - $571,000
5
Beds
3
Baths
1,736
Sq Ft
$300/Sq Ft
Est. Value
About This Home
This home is located at 23 Thorne St, Worcester, MA 01604 and is currently estimated at $520,333, approximately $299 per square foot. 23 Thorne St is a home located in Worcester County with nearby schools including Jacob Hiatt Magnet School, Chandler Magnet, and Grafton Street.
Ownership History
Date
Name
Owned For
Owner Type
Purchase Details
Closed on
Nov 16, 1998
Sold by
Iacovone Louis A and Iacovone Diane C
Bought by
Choruzek Stanley
Current Estimated Value
Home Financials for this Owner
Home Financials are based on the most recent Mortgage that was taken out on this home.
Original Mortgage
$58,900
Outstanding Balance
$12,924
Interest Rate
6.65%
Mortgage Type
Purchase Money Mortgage
Estimated Equity
$507,409
Purchase Details
Closed on
Dec 19, 1995
Sold by
Red Corp
Bought by
Iacovone Louis
Home Financials for this Owner
Home Financials are based on the most recent Mortgage that was taken out on this home.
Original Mortgage
$49,400
Interest Rate
7.43%
Mortgage Type
Purchase Money Mortgage
Purchase Details
Closed on
Feb 22, 1995
Sold by
Equitable Mtg Assoc
Bought by
Red Corp
Create a Home Valuation Report for This Property
The Home Valuation Report is an in-depth analysis detailing your home's value as well as a comparison with similar homes in the area
Home Values in the Area
Average Home Value in this Area
Purchase History
| Date | Buyer | Sale Price | Title Company |
|---|---|---|---|
| Choruzek Stanley | $62,000 | -- | |
| Iacovone Louis | $52,000 | -- | |
| Red Corp | $16,000 | -- |
Source: Public Records
Mortgage History
| Date | Status | Borrower | Loan Amount |
|---|---|---|---|
| Open | Red Corp | $58,900 | |
| Previous Owner | Red Corp | $49,400 | |
| Previous Owner | Red Corp | $72,500 |
Source: Public Records
Tax History Compared to Growth
Tax History
| Year | Tax Paid | Tax Assessment Tax Assessment Total Assessment is a certain percentage of the fair market value that is determined by local assessors to be the total taxable value of land and additions on the property. | Land | Improvement |
|---|---|---|---|---|
| 2025 | $5,874 | $445,300 | $85,400 | $359,900 |
| 2024 | $5,738 | $417,300 | $85,400 | $331,900 |
| 2023 | $5,310 | $370,300 | $74,300 | $296,000 |
| 2022 | $4,768 | $313,500 | $59,400 | $254,100 |
| 2021 | $3,930 | $241,400 | $47,500 | $193,900 |
| 2020 | $2,904 | $170,800 | $47,200 | $123,600 |
| 2019 | $2,966 | $164,800 | $41,200 | $123,600 |
| 2018 | $3,022 | $159,800 | $41,200 | $118,600 |
| 2017 | $2,883 | $150,000 | $41,200 | $108,800 |
| 2016 | $2,758 | $133,800 | $30,100 | $103,700 |
| 2015 | $2,685 | $133,800 | $30,100 | $103,700 |
| 2014 | $2,614 | $133,800 | $30,100 | $103,700 |
Source: Public Records
Map
Nearby Homes