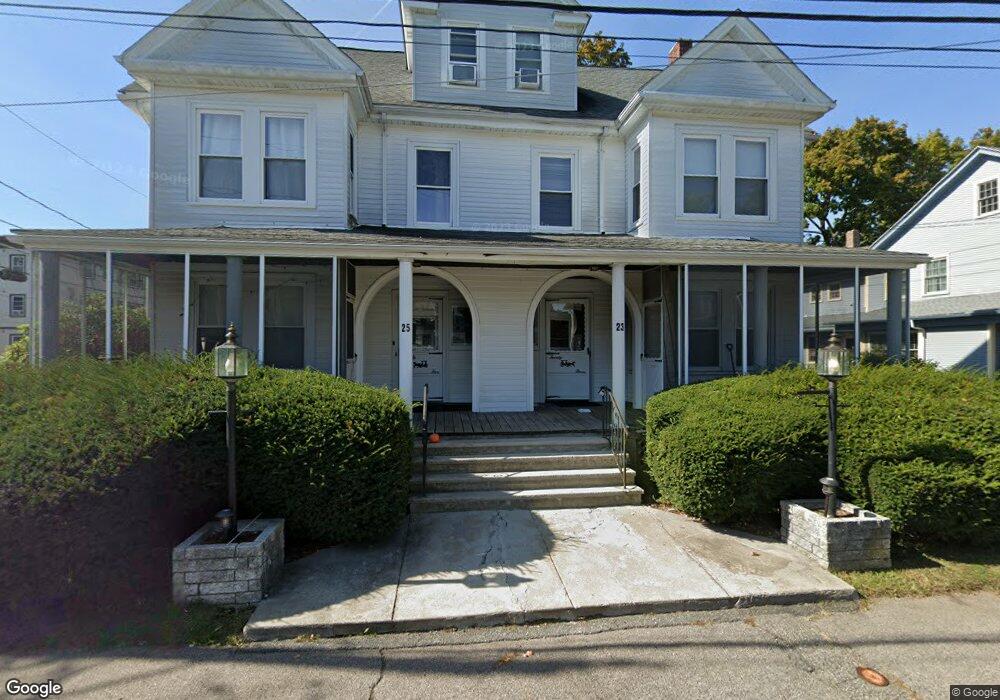
23 Townsend St Unit 25 Waltham, MA 02453
Bleachery NeighborhoodEstimated Value: $1,137,200 - $1,404,000
9
Beds
6
Baths
4,930
Sq Ft
$265/Sq Ft
Est. Value
About This Home
This home is located at 23 Townsend St Unit 25, Waltham, MA 02453 and is currently estimated at $1,305,800, approximately $264 per square foot. 23 Townsend St Unit 25 is a home located in Middlesex County with nearby schools including James Fitzgerald Elementary School, John W. Mcdevitt Middle School, and Waltham Sr High School.
Ownership History
Date
Name
Owned For
Owner Type
Purchase Details
Closed on
Mar 10, 2010
Sold by
Li Xie Yin Lin and Li Ling
Bought by
Xie Tr Yin Lin
Current Estimated Value
Purchase Details
Closed on
Nov 30, 2009
Sold by
Evergreen-Waltham Rt
Bought by
Xie Yin Lin
Home Financials for this Owner
Home Financials are based on the most recent Mortgage that was taken out on this home.
Original Mortgage
$468,000
Interest Rate
4.92%
Purchase Details
Closed on
Jun 30, 2008
Sold by
Delaney Denise M and Hernandez Denise M
Bought by
Evergreen Waltham Rt
Home Financials for this Owner
Home Financials are based on the most recent Mortgage that was taken out on this home.
Original Mortgage
$472,500
Interest Rate
6.07%
Mortgage Type
Purchase Money Mortgage
Create a Home Valuation Report for This Property
The Home Valuation Report is an in-depth analysis detailing your home's value as well as a comparison with similar homes in the area
Home Values in the Area
Average Home Value in this Area
Purchase History
| Date | Buyer | Sale Price | Title Company |
|---|---|---|---|
| Xie Tr Yin Lin | -- | -- | |
| Xie Yin Lin | -- | -- | |
| Evergreen Waltham Rt | $525,000 | -- |
Source: Public Records
Mortgage History
| Date | Status | Borrower | Loan Amount |
|---|---|---|---|
| Previous Owner | Xie Yin Lin | $468,000 | |
| Previous Owner | Evergreen Waltham Rt | $472,500 |
Source: Public Records
Tax History Compared to Growth
Tax History
| Year | Tax Paid | Tax Assessment Tax Assessment Total Assessment is a certain percentage of the fair market value that is determined by local assessors to be the total taxable value of land and additions on the property. | Land | Improvement |
|---|---|---|---|---|
| 2025 | $12,423 | $1,265,100 | $353,000 | $912,100 |
| 2024 | $11,305 | $1,172,700 | $350,800 | $821,900 |
| 2023 | $10,800 | $1,046,500 | $336,200 | $710,300 |
| 2022 | $10,995 | $987,000 | $307,000 | $680,000 |
| 2021 | $9,382 | $828,800 | $248,500 | $580,300 |
| 2020 | $9,066 | $758,700 | $219,300 | $539,400 |
| 2019 | $8,195 | $647,300 | $217,100 | $430,200 |
| 2018 | $7,444 | $590,300 | $201,000 | $389,300 |
| 2017 | $7,184 | $572,000 | $182,700 | $389,300 |
| 2016 | $7,001 | $572,000 | $182,700 | $389,300 |
| 2015 | $6,247 | $475,800 | $164,400 | $311,400 |
Source: Public Records
Map
Nearby Homes
- 266-274 River St
- 70 School St
- 240 River St
- 214 Church St
- 158 Church St
- 220 Grove St Unit 1
- 28-32 Calvary St
- 180 River St Unit 9
- 176 River St
- 7-11.5 Felton
- 59 Farnum Rd
- 164 Grove St
- 10 Naviens Ln Unit 2
- 160 School St Unit 3-1
- 135 Grove St Unit 135
- 39 Clinton St Unit 2
- 39 Clinton St Unit 1
- 61 Hall St Unit 1
- 61 Hall St Unit 9
- 61 Hall St Unit 2
- 23 Townsend St Unit b
- 23-25 Townsend St
- 25 Townsend St
- 19 Townsend St
- 27 Barton St #1 & #2
- 26 Newton St Unit 28
- 26 Newton St
- 25 Barton St Unit 3
- 22 Townsend St
- 22 Newton St
- 21 Barton St
- 23 Barton St
- 23 Barton St Unit 2
- 15 Barton St
- 9 Barton St Unit 32
- 9 Barton St Unit 31
- 9 Barton St Unit 22
- 9 Barton St Unit 21
- 9 Barton St Unit 2
- 9 Barton St Unit 1