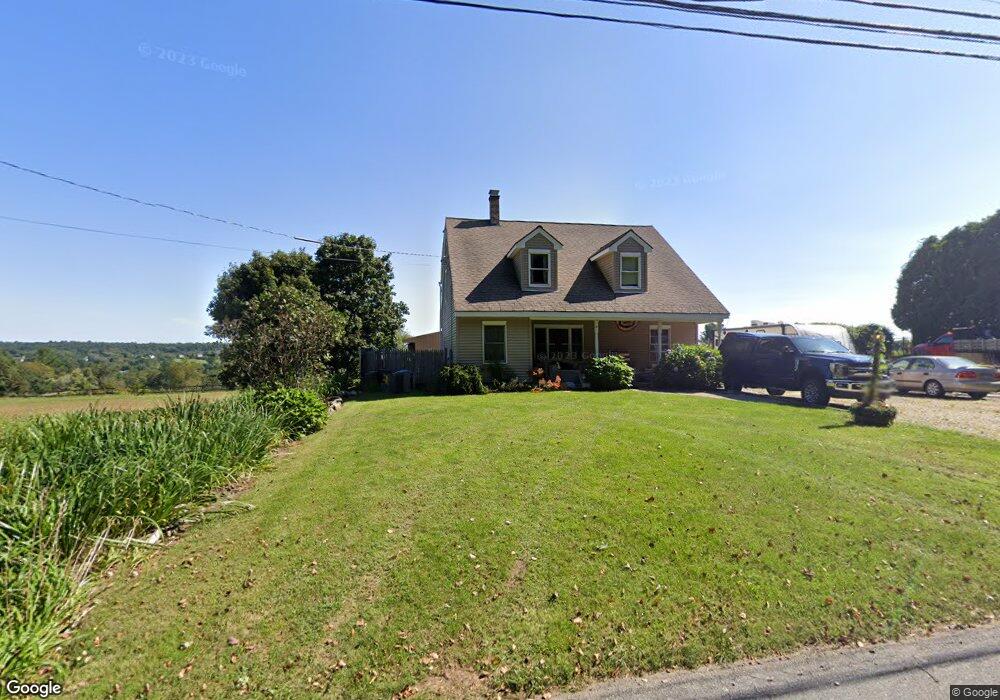
23 Tyrone Rd Pomfret Center, CT 06259
Estimated Value: $324,000 - $521,000
3
Beds
2
Baths
2,093
Sq Ft
$198/Sq Ft
Est. Value
About This Home
This home is located at 23 Tyrone Rd, Pomfret Center, CT 06259 and is currently estimated at $414,907, approximately $198 per square foot. 23 Tyrone Rd is a home located in Windham County with nearby schools including Pomfret Community School, Rectory School, and Putnam Science Academy.
Ownership History
Date
Name
Owned For
Owner Type
Purchase Details
Closed on
Apr 11, 1997
Sold by
Bouchard Mechelle M
Bought by
Scandalito John S
Current Estimated Value
Home Financials for this Owner
Home Financials are based on the most recent Mortgage that was taken out on this home.
Original Mortgage
$53,600
Interest Rate
7.55%
Mortgage Type
Unknown
Create a Home Valuation Report for This Property
The Home Valuation Report is an in-depth analysis detailing your home's value as well as a comparison with similar homes in the area
Home Values in the Area
Average Home Value in this Area
Purchase History
| Date | Buyer | Sale Price | Title Company |
|---|---|---|---|
| Scandalito John S | $67,000 | -- |
Source: Public Records
Mortgage History
| Date | Status | Borrower | Loan Amount |
|---|---|---|---|
| Closed | Scandalito John S | $38,000 | |
| Open | Scandalito John S | $144,000 | |
| Closed | Scandalito John S | $53,600 | |
| Previous Owner | Scandalito John S | $35,000 |
Source: Public Records
Tax History Compared to Growth
Tax History
| Year | Tax Paid | Tax Assessment Tax Assessment Total Assessment is a certain percentage of the fair market value that is determined by local assessors to be the total taxable value of land and additions on the property. | Land | Improvement |
|---|---|---|---|---|
| 2025 | $4,631 | $223,400 | $43,300 | $180,100 |
| 2024 | $5,869 | $154,200 | $41,200 | $113,000 |
| 2023 | $4,125 | $154,200 | $41,200 | $113,000 |
| 2022 | $4,123 | $154,200 | $41,200 | $113,000 |
| 2021 | $4,088 | $154,200 | $41,200 | $113,000 |
| 2020 | $3,375 | $122,200 | $39,400 | $82,800 |
| 2019 | $3,321 | $122,200 | $39,400 | $82,800 |
| 2018 | $3,287 | $122,200 | $39,400 | $82,800 |
| 2017 | $3,535 | $122,200 | $39,400 | $82,800 |
| 2016 | $3,128 | $122,200 | $39,400 | $82,800 |
| 2015 | $3,364 | $133,300 | $50,400 | $82,900 |
| 2014 | $3,350 | $133,300 | $50,400 | $82,900 |
Source: Public Records
Map
Nearby Homes
- 30 Tyrone Rd
- 357 Wrights Crossing Rd
- 219 Pomfret St
- 5 Woodstock Hills Dr
- 50 Richmond Rd Unit 19
- 2 Hampton Rd
- 224 Pomfret St
- 257 Sabin St Unit 23
- 130 Tripp Rd
- 182 Baxter Rd
- 80 Averill Rd
- 20 Harrissville Rd
- 6 Harrisville Rd
- 16 Wilkinson St
- 97 Blossom Dr
- 6 Prospect St
- 172 Peake Brook Rd
- 29 Prospect St Unit A
- 115 Grove St
- 15 Maynard St