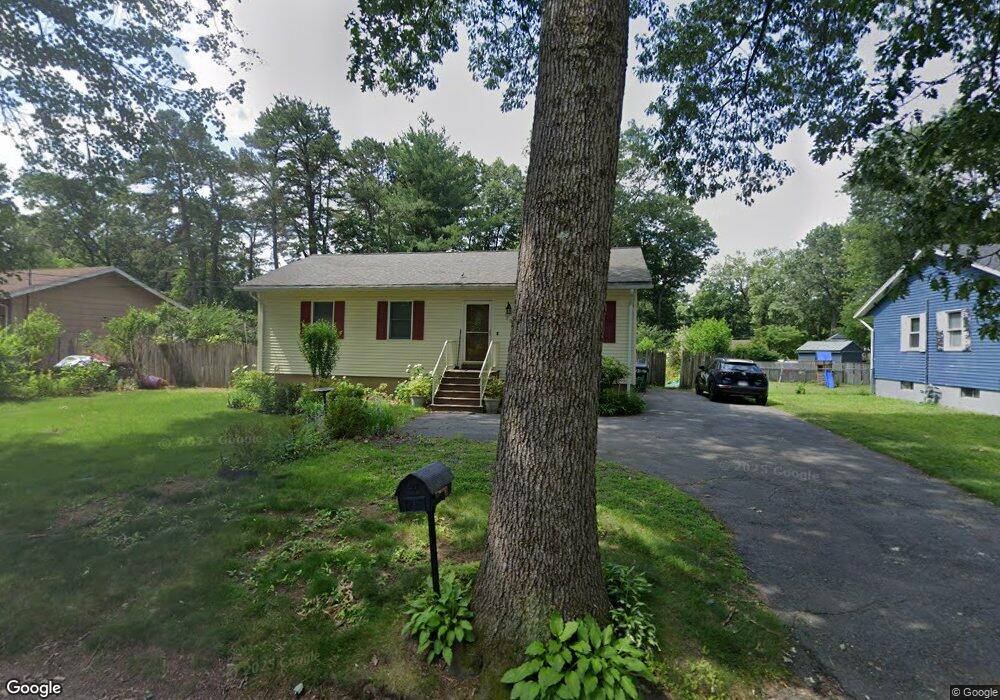
23 Undine Cir Springfield, MA 01109
Sixteen Acres NeighborhoodEstimated Value: $275,000 - $316,000
3
Beds
1
Bath
1,092
Sq Ft
$267/Sq Ft
Est. Value
About This Home
This home is located at 23 Undine Cir, Springfield, MA 01109 and is currently estimated at $291,664, approximately $267 per square foot. 23 Undine Cir is a home located in Hampden County with nearby schools including Frank H. Freedman School, John J Duggan Middle, and Springfield High School of Science and Technology.
Ownership History
Date
Name
Owned For
Owner Type
Purchase Details
Closed on
Nov 15, 1994
Sold by
Department Of Housing & Urban Dev
Bought by
Marlow Joseph S and Marlow Angela B
Current Estimated Value
Home Financials for this Owner
Home Financials are based on the most recent Mortgage that was taken out on this home.
Original Mortgage
$30,000
Interest Rate
8.78%
Mortgage Type
Purchase Money Mortgage
Purchase Details
Closed on
Jan 19, 1994
Sold by
Midcoast Mtg Corp
Bought by
Department Of Housing & Urban Dev
Purchase Details
Closed on
Oct 29, 1993
Sold by
Brown Derek R
Bought by
Midcoast Mtg Corp
Purchase Details
Closed on
Jan 30, 1990
Sold by
Trujillo Jose L
Bought by
Brown Derek R
Home Financials for this Owner
Home Financials are based on the most recent Mortgage that was taken out on this home.
Original Mortgage
$98,874
Interest Rate
9.67%
Mortgage Type
Purchase Money Mortgage
Create a Home Valuation Report for This Property
The Home Valuation Report is an in-depth analysis detailing your home's value as well as a comparison with similar homes in the area
Home Values in the Area
Average Home Value in this Area
Purchase History
| Date | Buyer | Sale Price | Title Company |
|---|---|---|---|
| Marlow Joseph S | $51,500 | -- | |
| Department Of Housing & Urban Dev | $97,871 | -- | |
| Midcoast Mtg Corp | $127,529 | -- | |
| Brown Derek R | $97,500 | -- |
Source: Public Records
Mortgage History
| Date | Status | Borrower | Loan Amount |
|---|---|---|---|
| Closed | Brown Derek R | $30,000 | |
| Previous Owner | Brown Derek R | $98,874 | |
| Previous Owner | Brown Derek R | $29,000 |
Source: Public Records
Tax History
| Year | Tax Paid | Tax Assessment Tax Assessment Total Assessment is a certain percentage of the fair market value that is determined by local assessors to be the total taxable value of land and additions on the property. | Land | Improvement |
|---|---|---|---|---|
| 2025 | $3,631 | $231,600 | $52,200 | $179,400 |
| 2024 | $3,483 | $216,900 | $52,200 | $164,700 |
| 2023 | $3,529 | $207,000 | $49,700 | $157,300 |
| 2022 | $3,278 | $174,200 | $49,700 | $124,500 |
| 2021 | $3,047 | $161,200 | $45,100 | $116,100 |
| 2020 | $2,783 | $142,500 | $45,100 | $97,400 |
| 2019 | $2,795 | $142,000 | $45,100 | $96,900 |
| 2018 | $2,586 | $131,400 | $45,100 | $86,300 |
| 2017 | $2,652 | $134,900 | $50,100 | $84,800 |
| 2016 | $2,471 | $125,700 | $50,100 | $75,600 |
| 2015 | $2,433 | $123,700 | $50,100 | $73,600 |
Source: Public Records
Map
Nearby Homes