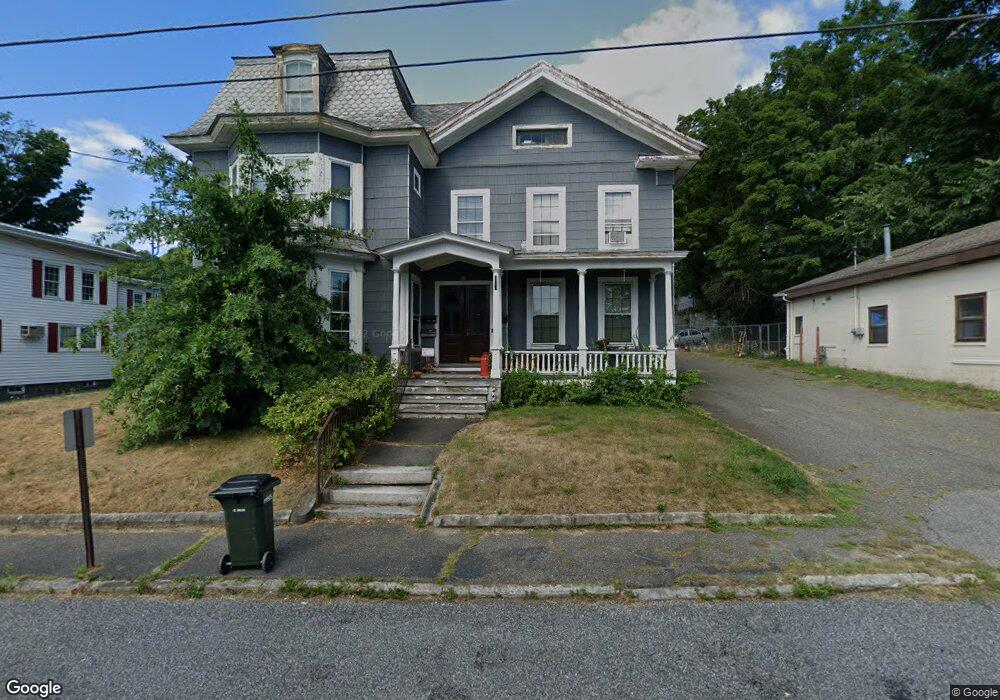
23 Union St Winsted, CT 06098
Estimated Value: $326,630
Studio
--
Bath
--
Sq Ft
27,878
Sq Ft
About This Home
This home is located at 23 Union St, Winsted, CT 06098 and is currently estimated at $326,630. 23 Union St is a home located in Litchfield County with nearby schools including Pearson School, Explorations Charter School, and St Anthony School.
Ownership History
Date
Name
Owned For
Owner Type
Purchase Details
Closed on
Jan 30, 2018
Sold by
Winchester Town Of
Bought by
Reade Christopher
Current Estimated Value
Home Financials for this Owner
Home Financials are based on the most recent Mortgage that was taken out on this home.
Original Mortgage
$8,113
Outstanding Balance
$6,845
Interest Rate
3.93%
Mortgage Type
New Conventional
Estimated Equity
$319,785
Purchase Details
Closed on
Oct 20, 2008
Sold by
Riiska Beverly R
Bought by
Reade Barry
Create a Home Valuation Report for This Property
The Home Valuation Report is an in-depth analysis detailing your home's value as well as a comparison with similar homes in the area
Home Values in the Area
Average Home Value in this Area
Purchase History
| Date | Buyer | Sale Price | Title Company |
|---|---|---|---|
| Reade Christopher | -- | -- | |
| Reade Christopher | -- | -- | |
| Reade Barry | $195,000 | -- | |
| Reade Barry | $195,000 | -- |
Source: Public Records
Mortgage History
| Date | Status | Borrower | Loan Amount |
|---|---|---|---|
| Open | Reade Christopher | $8,113 | |
| Closed | Reade Christopher | $8,113 |
Source: Public Records
Tax History
| Year | Tax Paid | Tax Assessment Tax Assessment Total Assessment is a certain percentage of the fair market value that is determined by local assessors to be the total taxable value of land and additions on the property. | Land | Improvement |
|---|---|---|---|---|
| 2025 | $3,267 | $112,000 | $8,470 | $103,530 |
| 2024 | $3,051 | $112,000 | $8,470 | $103,530 |
| 2023 | $2,956 | $112,000 | $8,470 | $103,530 |
| 2022 | $4,635 | $138,180 | $7,560 | $130,620 |
| 2021 | $4,635 | $138,180 | $7,560 | $130,620 |
| 2020 | $4,635 | $138,180 | $7,560 | $130,620 |
| 2019 | $4,635 | $138,180 | $7,560 | $130,620 |
| 2018 | $6,337 | $188,930 | $50,540 | $138,390 |
| 2017 | $6,128 | $182,700 | $50,540 | $132,160 |
| 2016 | $6,128 | $182,700 | $50,540 | $132,160 |
| 2015 | $5,974 | $182,700 | $50,540 | $132,160 |
| 2014 | $5,830 | $182,700 | $50,540 | $132,160 |
Source: Public Records
Map
Nearby Homes
Your Personal Tour Guide
Ask me questions while you tour the home.