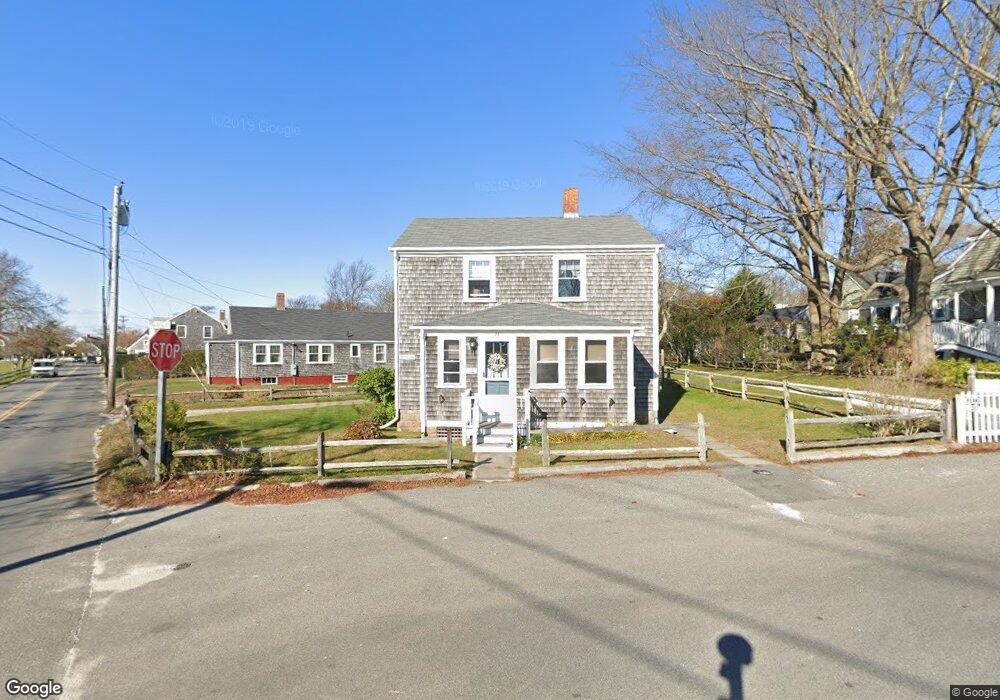
23 Vestal St Nantucket, MA 02554
Estimated Value: $2,103,000 - $2,800,000
3
Beds
2
Baths
1,274
Sq Ft
$1,816/Sq Ft
Est. Value
About This Home
This home is located at 23 Vestal St, Nantucket, MA 02554 and is currently estimated at $2,313,378, approximately $1,815 per square foot. 23 Vestal St is a home located in Nantucket County with nearby schools including Nantucket Elementary School, Cyrus Peirce Middle School, and Nantucket High School.
Ownership History
Date
Name
Owned For
Owner Type
Purchase Details
Closed on
Sep 9, 2016
Sold by
Cady Kenneth L
Bought by
Wooding-Cady Lt and Cady
Current Estimated Value
Purchase Details
Closed on
Nov 29, 2011
Sold by
Lawrence M Cady Ret
Bought by
Knight Christina C and Knight Kenneth L
Create a Home Valuation Report for This Property
The Home Valuation Report is an in-depth analysis detailing your home's value as well as a comparison with similar homes in the area
Home Values in the Area
Average Home Value in this Area
Purchase History
| Date | Buyer | Sale Price | Title Company |
|---|---|---|---|
| Wooding-Cady Lt | -- | -- | |
| Wooding-Cady Lt | -- | -- | |
| Wooding-Cady Lt | -- | -- | |
| Knight Christina C | -- | -- | |
| Knight Christina C | -- | -- |
Source: Public Records
Mortgage History
| Date | Status | Borrower | Loan Amount |
|---|---|---|---|
| Previous Owner | Knight Christina C | $20,000 |
Source: Public Records
Tax History Compared to Growth
Tax History
| Year | Tax Paid | Tax Assessment Tax Assessment Total Assessment is a certain percentage of the fair market value that is determined by local assessors to be the total taxable value of land and additions on the property. | Land | Improvement |
|---|---|---|---|---|
| 2025 | $5,107 | $1,557,000 | $929,800 | $627,200 |
| 2024 | $5,099 | $1,629,000 | $1,010,600 | $618,400 |
| 2023 | $4,291 | $1,336,700 | $885,500 | $451,200 |
| 2022 | $3,779 | $1,010,300 | $674,100 | $336,200 |
| 2021 | $3,551 | $978,200 | $642,000 | $336,200 |
| 2020 | $3,436 | $995,900 | $642,000 | $353,900 |
| 2019 | $3,343 | $994,900 | $641,000 | $353,900 |
| 2018 | $3,387 | $959,600 | $641,000 | $318,600 |
| 2017 | $3,223 | $950,700 | $641,000 | $309,700 |
| 2016 | $3,165 | $941,900 | $641,000 | $300,900 |
| 2015 | $2,930 | $811,700 | $553,000 | $258,700 |
| 2014 | $3,022 | $803,700 | $553,000 | $250,700 |
Source: Public Records
Map
Nearby Homes