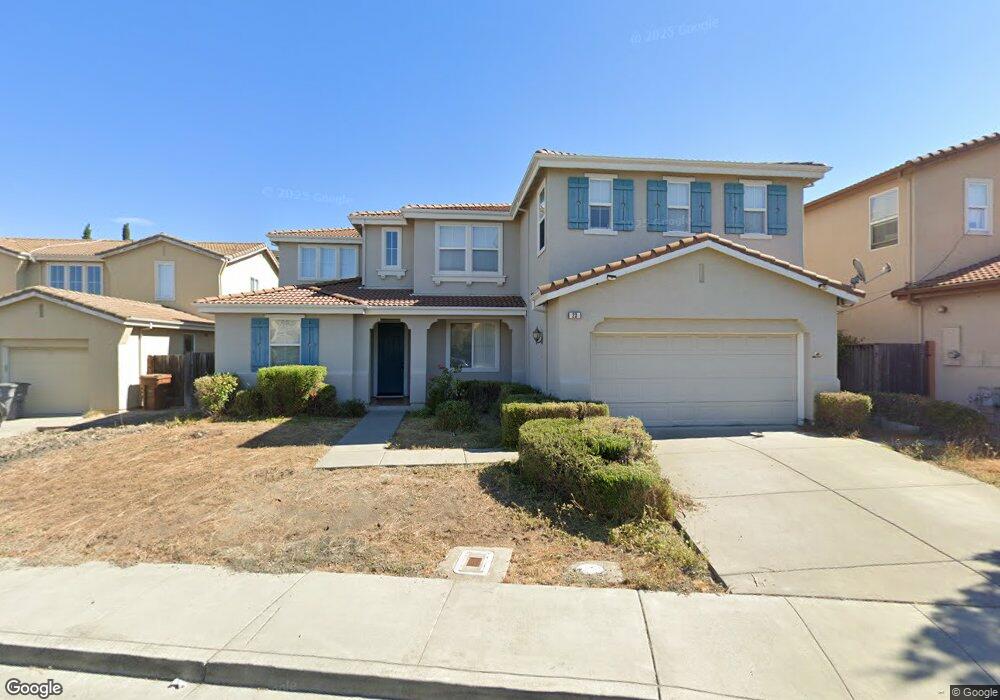
23 Via Pescara American Canyon, CA 94503
Estimated Value: $744,000 - $901,000
5
Beds
3
Baths
3,203
Sq Ft
$263/Sq Ft
Est. Value
About This Home
This home is located at 23 Via Pescara, American Canyon, CA 94503 and is currently estimated at $841,161, approximately $262 per square foot. 23 Via Pescara is a home located in Napa County with nearby schools including Canyon Oaks Elementary School, American Canyon Middle School, and American Canyon High School.
Ownership History
Date
Name
Owned For
Owner Type
Purchase Details
Closed on
Feb 16, 2021
Sold by
Wee Chii Liang and Oei Fanna
Bought by
Wee Chii Liang and Oei Fanna
Current Estimated Value
Home Financials for this Owner
Home Financials are based on the most recent Mortgage that was taken out on this home.
Original Mortgage
$548,000
Outstanding Balance
$490,968
Interest Rate
2.8%
Mortgage Type
New Conventional
Estimated Equity
$350,193
Purchase Details
Closed on
Jan 23, 2021
Sold by
Wee Chi Liang and Wee Ci Liang
Bought by
Wee Chi Liang and Oei Fanna
Home Financials for this Owner
Home Financials are based on the most recent Mortgage that was taken out on this home.
Original Mortgage
$548,000
Outstanding Balance
$490,968
Interest Rate
2.8%
Mortgage Type
New Conventional
Estimated Equity
$350,193
Purchase Details
Closed on
Dec 10, 2016
Sold by
Wee Chii Liang
Bought by
Wee Chii Liang and Oei Fanna
Home Financials for this Owner
Home Financials are based on the most recent Mortgage that was taken out on this home.
Original Mortgage
$379,200
Interest Rate
3.54%
Mortgage Type
New Conventional
Purchase Details
Closed on
Dec 9, 2013
Sold by
Oei Fanna
Bought by
Wee Chii Liang
Home Financials for this Owner
Home Financials are based on the most recent Mortgage that was taken out on this home.
Original Mortgage
$301,000
Interest Rate
4.04%
Mortgage Type
New Conventional
Purchase Details
Closed on
Jun 12, 2007
Sold by
Winfree Thomas T and Winfree Holly C
Bought by
Patterson Vernon B and Patterson Karen A
Home Financials for this Owner
Home Financials are based on the most recent Mortgage that was taken out on this home.
Original Mortgage
$405,000
Interest Rate
6.14%
Mortgage Type
Negative Amortization
Purchase Details
Closed on
Sep 26, 2006
Sold by
Winfree Thomas T and Winfree Holly C
Bought by
Winfree Thomas T and Winfree Holly C
Home Financials for this Owner
Home Financials are based on the most recent Mortgage that was taken out on this home.
Original Mortgage
$417,000
Interest Rate
6.53%
Mortgage Type
New Conventional
Purchase Details
Closed on
Oct 18, 2004
Sold by
Winfree Thomas T and Winfree Holly C
Bought by
Winfree Thomas T and Winfree Holly C
Purchase Details
Closed on
Mar 5, 2002
Sold by
Shea Homes Ltd Partnership
Bought by
Winfree Thomas T and Winfree Holly C
Home Financials for this Owner
Home Financials are based on the most recent Mortgage that was taken out on this home.
Original Mortgage
$254,300
Interest Rate
6.85%
Create a Home Valuation Report for This Property
The Home Valuation Report is an in-depth analysis detailing your home's value as well as a comparison with similar homes in the area
Home Values in the Area
Average Home Value in this Area
Purchase History
| Date | Buyer | Sale Price | Title Company |
|---|---|---|---|
| Wee Chii Liang | -- | Commonwealth Land Title Co | |
| Wee Chi Liang | -- | None Available | |
| Wee Chii Liang | -- | Servicelink | |
| Wee Chii Liang | -- | First American Title Company | |
| Wee Chii Liang | $430,000 | First American Title Company | |
| Patterson Vernon B | $690,000 | Fidelity National Title Co | |
| Winfree Thomas T | -- | Old Republic Title Company | |
| Winfree Thomas T | -- | Old Republic Title Company | |
| Winfree Thomas T | -- | -- | |
| Winfree Thomas T | $436,500 | First American Title Co |
Source: Public Records
Mortgage History
| Date | Status | Borrower | Loan Amount |
|---|---|---|---|
| Open | Wee Chii Liang | $548,000 | |
| Closed | Wee Chii Liang | $379,200 | |
| Closed | Wee Chii Liang | $301,000 | |
| Previous Owner | Patterson Vernon B | $405,000 | |
| Previous Owner | Winfree Thomas T | $417,000 | |
| Previous Owner | Winfree Thomas T | $254,300 |
Source: Public Records
Tax History Compared to Growth
Tax History
| Year | Tax Paid | Tax Assessment Tax Assessment Total Assessment is a certain percentage of the fair market value that is determined by local assessors to be the total taxable value of land and additions on the property. | Land | Improvement |
|---|---|---|---|---|
| 2025 | $7,102 | $527,113 | $110,323 | $416,790 |
| 2024 | $7,102 | $516,778 | $108,160 | $408,618 |
| 2023 | $7,102 | $506,646 | $106,040 | $400,606 |
| 2022 | $6,927 | $496,712 | $103,961 | $392,751 |
| 2021 | $6,782 | $486,973 | $101,923 | $385,050 |
| 2020 | $6,910 | $481,980 | $100,878 | $381,102 |
| 2019 | $6,905 | $472,530 | $98,900 | $373,630 |
| 2018 | $6,846 | $463,265 | $96,961 | $366,304 |
| 2017 | $6,749 | $454,182 | $95,060 | $359,122 |
| 2016 | $6,628 | $445,278 | $93,197 | $352,081 |
| 2015 | $6,300 | $438,591 | $91,798 | $346,793 |
| 2014 | $6,209 | $430,000 | $90,000 | $340,000 |
Source: Public Records
Map
Nearby Homes
- 23 Castellina Cir
- 75 Castellina Cir
- 1710 American Canyon Rd
- 121 Sutton Place Unit Lot16
- 9 Kevin Ln
- 224 Pinecreek Ln
- 2525 Flosden Rd Unit 61
- 1305 Corcoran Ave
- 420 Sandstone Dr
- 350 Notre Dame Dr
- 172 Smokey Hills Dr
- 244 American Canyon Rd Unit 193
- 244 American Canyon Rd Unit 25
- 244 American Canyon Rd Unit 102
- 200 Fieldstone Ct
- 106 Fieldstone Way
- 3000 Broadway St Unit 16
- 3000 Broadway St Unit 13
- 3000 St Unit 92
- 500 Granite Springs Way
- 19 Via Pescara Unkn
- 19 Via Pescara
- 27 Via Pescara
- 45 Via Pescara
- 6 Elba Ct
- 15 Via Pescara
- 22 Via Pescara
- 49 Via Pescara
- 26 Via Pescara
- 18 Via Pescara
- 10 Elba Ct
- 30 Via Pescara
- 30 Via Pescara Unkn
- 42 Via Pescara
- 38 Via Pescara
- 14 Via Pescara
- 46 Via Pescara
- 53 Via Pescara
- 34 Via Pescara
- 50 Via Pescara