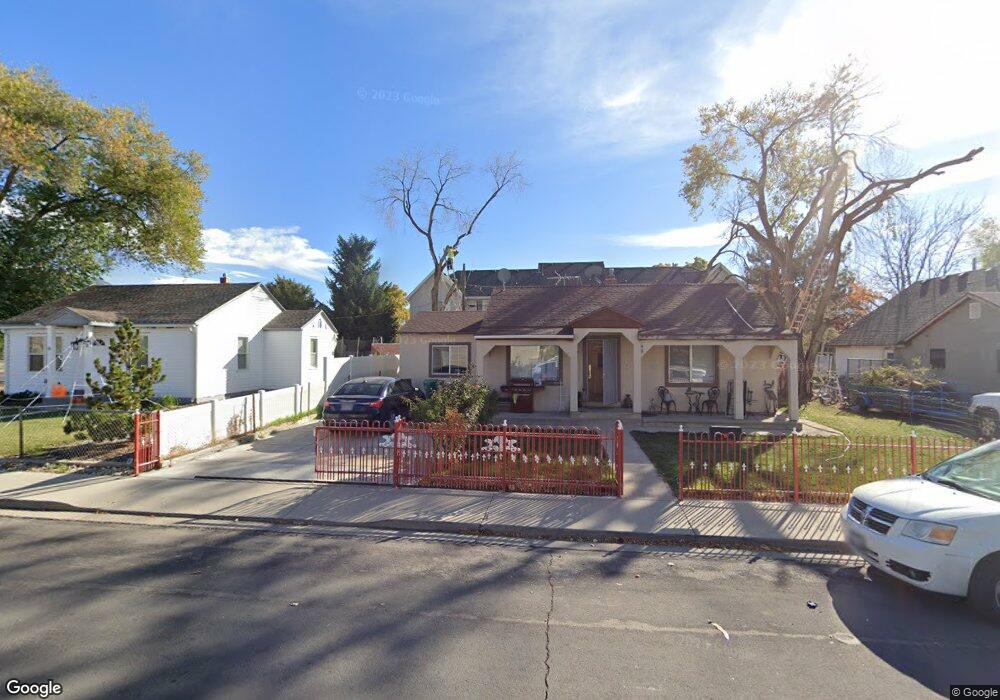
23 W 700 N Orem, UT 84057
Sharon NeighborhoodEstimated Value: $349,000 - $392,000
2
Beds
1
Bath
996
Sq Ft
$375/Sq Ft
Est. Value
About This Home
This home is located at 23 W 700 N, Orem, UT 84057 and is currently estimated at $373,465, approximately $374 per square foot. 23 W 700 N is a home located in Utah County with nearby schools including Cascade Elementary School, Canyon View Junior High School, and Orem High School.
Ownership History
Date
Name
Owned For
Owner Type
Purchase Details
Closed on
Dec 9, 2016
Sold by
Monroy Hector
Bought by
Monroy Hector and Monroy Laura Susana
Current Estimated Value
Home Financials for this Owner
Home Financials are based on the most recent Mortgage that was taken out on this home.
Original Mortgage
$128,000
Outstanding Balance
$61,490
Interest Rate
3.47%
Mortgage Type
New Conventional
Estimated Equity
$311,975
Purchase Details
Closed on
Dec 17, 2013
Sold by
Monroy Hector
Bought by
Monroy Hector and Monroy Laura Susana
Purchase Details
Closed on
Jun 14, 2007
Sold by
Jepperson Joleen H and Hamilton Robert
Bought by
Monroy Hector
Home Financials for this Owner
Home Financials are based on the most recent Mortgage that was taken out on this home.
Original Mortgage
$4,110
Interest Rate
6.21%
Mortgage Type
Stand Alone Second
Create a Home Valuation Report for This Property
The Home Valuation Report is an in-depth analysis detailing your home's value as well as a comparison with similar homes in the area
Home Values in the Area
Average Home Value in this Area
Purchase History
We collect this data history from publicly available records. To have your information removed, we recommend requesting removal directly through your county’s website.
| Date | Buyer | Sale Price | Title Company |
|---|---|---|---|
| Monroy Hector | -- | Gateway Title Ins Agency Llc | |
| Monroy Hector | -- | Gateway Title Ins Agency Llc | |
| Monroy Hector | -- | Accommodation | |
| Monroy Hector | -- | Old Republic Title Company |
Source: Public Records
Mortgage History
We collect this data history from publicly available records. To have your information removed, we recommend requesting removal directly through your county’s website.
| Date | Status | Borrower | Loan Amount |
|---|---|---|---|
| Open | Monroy Hector | $128,000 | |
| Closed | Monroy Hector | $4,110 | |
| Closed | Monroy Hector | $134,883 |
Source: Public Records
Tax History
| Year | Tax Paid | Tax Assessment Tax Assessment Total Assessment is a certain percentage of the fair market value that is determined by local assessors to be the total taxable value of land and additions on the property. | Land | Improvement |
|---|---|---|---|---|
| 2025 | $1,446 | $182,655 | -- | -- |
| 2024 | $1,309 | $176,825 | $0 | $0 |
| 2023 | $1,309 | $172,040 | $0 | $0 |
| 2022 | $1,503 | $191,400 | $0 | $0 |
| 2021 | $1,281 | $247,000 | $125,800 | $121,200 |
| 2020 | $1,158 | $219,400 | $100,600 | $118,800 |
| 2019 | $996 | $196,300 | $90,800 | $105,500 |
| 2018 | $918 | $172,800 | $81,100 | $91,700 |
| 2017 | $841 | $84,865 | $0 | $0 |
| 2016 | $757 | $70,455 | $0 | $0 |
| 2015 | $796 | $70,070 | $0 | $0 |
| 2014 | $794 | $69,575 | $0 | $0 |
Source: Public Records
Map
Nearby Homes
Your Personal Tour Guide
Ask me questions while you tour the home.