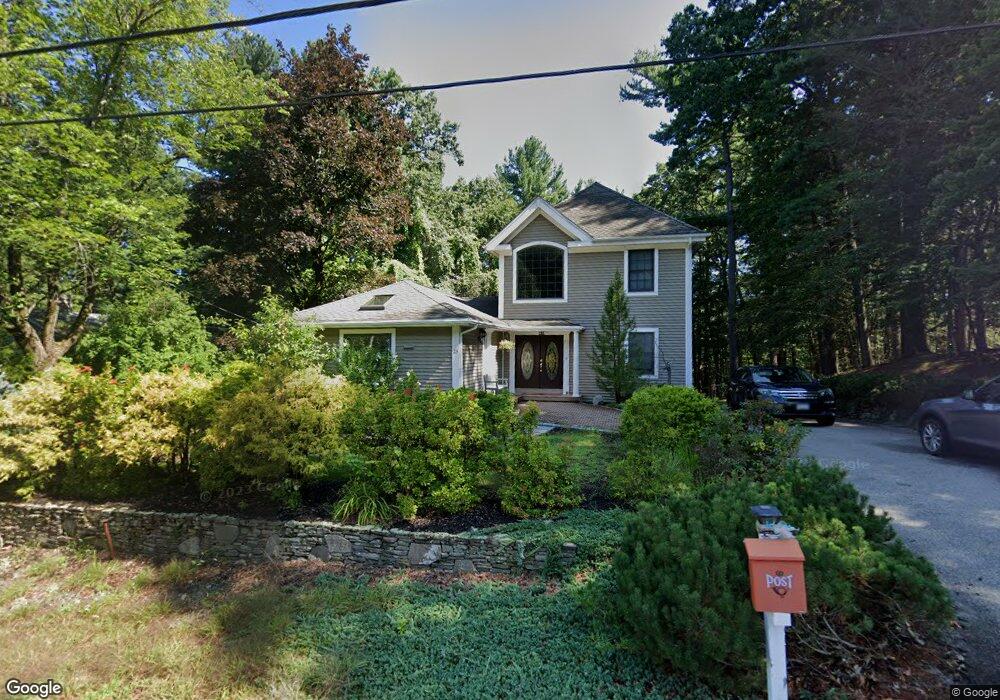
23 Wallace Rd Unit 1 Wayland, MA 01778
Estimated Value: $1,215,000 - $1,341,778
3
Beds
2
Baths
2,900
Sq Ft
$442/Sq Ft
Est. Value
About This Home
This home is located at 23 Wallace Rd Unit 1, Wayland, MA 01778 and is currently estimated at $1,282,945, approximately $442 per square foot. 23 Wallace Rd Unit 1 is a home located in Middlesex County with nearby schools including Wayland High School, Christa McAuliffe Charter School, and Veritas Christian Academy.
Ownership History
Date
Name
Owned For
Owner Type
Purchase Details
Closed on
Dec 15, 2009
Sold by
Kim Dae Yul and Kim Ok Jin
Bought by
Shi Xiang
Current Estimated Value
Purchase Details
Closed on
Aug 25, 2000
Sold by
Choi Eonjip D and Choi Ruth K
Bought by
Kim Dae Y and Kim Jin
Purchase Details
Closed on
May 25, 2000
Sold by
Choi Eonjip and Choi Ruth K
Bought by
Kimg Dae Yul and Kimg Ok Jin
Purchase Details
Closed on
Dec 20, 1999
Sold by
Hamilton Eleanor T Est and Matthews
Bought by
Choi Eonjip and Choi Ruth K
Create a Home Valuation Report for This Property
The Home Valuation Report is an in-depth analysis detailing your home's value as well as a comparison with similar homes in the area
Home Values in the Area
Average Home Value in this Area
Purchase History
| Date | Buyer | Sale Price | Title Company |
|---|---|---|---|
| Shi Xiang | $470,000 | -- | |
| Shi Xiang | $470,000 | -- | |
| Kim Dae Y | $99,000 | -- | |
| Kimg Dae Yul | $110,000 | -- | |
| Choi Eonjip | $215,000 | -- |
Source: Public Records
Mortgage History
| Date | Status | Borrower | Loan Amount |
|---|---|---|---|
| Open | Choi Eonjip | $470,350 | |
| Closed | Choi Eonjip | $370,000 |
Source: Public Records
Tax History
| Year | Tax Paid | Tax Assessment Tax Assessment Total Assessment is a certain percentage of the fair market value that is determined by local assessors to be the total taxable value of land and additions on the property. | Land | Improvement |
|---|---|---|---|---|
| 2025 | $16,673 | $1,066,700 | $565,100 | $501,600 |
| 2024 | $15,787 | $1,017,200 | $538,300 | $478,900 |
| 2023 | $14,863 | $892,700 | $489,300 | $403,400 |
| 2022 | $14,328 | $780,800 | $405,100 | $375,700 |
| 2021 | $13,779 | $744,000 | $368,300 | $375,700 |
| 2020 | $13,213 | $744,000 | $368,300 | $375,700 |
| 2019 | $12,606 | $689,600 | $350,800 | $338,800 |
| 2018 | $11,867 | $658,200 | $350,800 | $307,400 |
| 2017 | $11,421 | $629,600 | $334,200 | $295,400 |
| 2016 | $10,593 | $610,900 | $327,600 | $283,300 |
| 2015 | $9,515 | $517,400 | $279,400 | $238,000 |
Source: Public Records
Map
Nearby Homes
- 225 W Plain St
- 22 Lakeshore Dr
- 108 Dudley Rd
- 123 Dudley Rd
- 13 Potter Rd
- 67 Meadow St
- 1 Foley Dr
- 26 Dudley Rd
- 11 Danforth Park Rd
- 262 Cochituate Rd
- 492 Elm St
- 1 Cole Rd
- 186 Main St
- 71 Nicholas Rd Unit H
- 37 Davelin Rd
- 81 Nicholas Rd Unit B
- 38 Bradford Rd
- 689 Old Connecticut Path
- 62 Central St
- 19 Park Ave