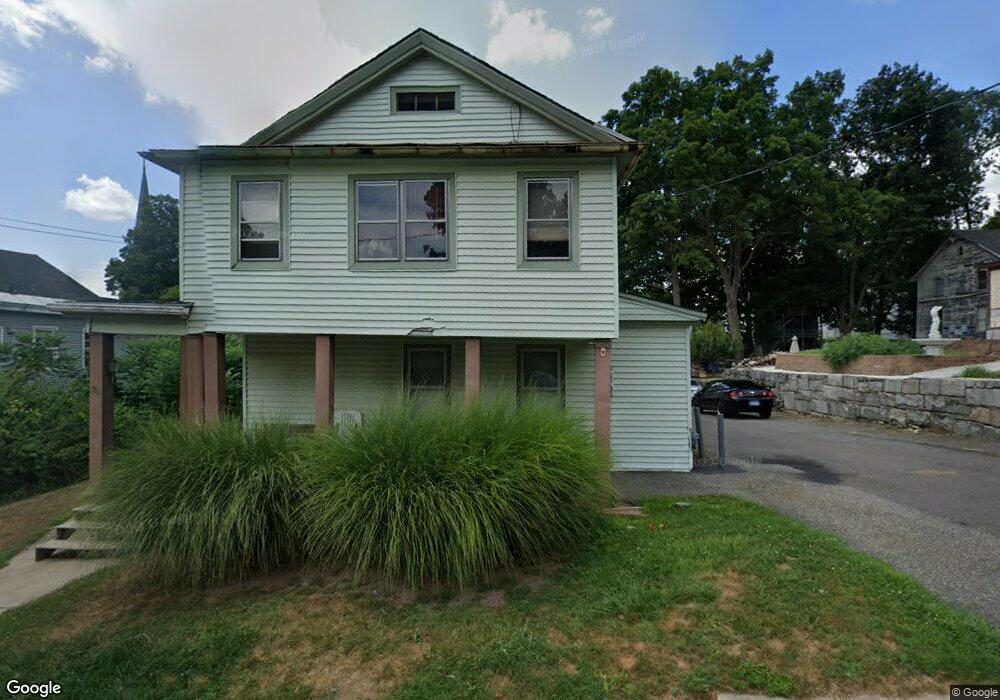
23 Walnut St Winsted, CT 06098
Estimated Value: $288,055 - $348,000
5
Beds
2
Baths
2,702
Sq Ft
$114/Sq Ft
Est. Value
About This Home
This home is located at 23 Walnut St, Winsted, CT 06098 and is currently estimated at $309,014, approximately $114 per square foot. 23 Walnut St is a home located in Litchfield County with nearby schools including Pearson School, Explorations Charter School, and St Anthony School.
Ownership History
Date
Name
Owned For
Owner Type
Purchase Details
Closed on
Jul 25, 2024
Sold by
Landi Maria I
Bought by
Landi Deonna
Current Estimated Value
Purchase Details
Closed on
Jun 1, 1984
Bought by
Landi Maria I
Create a Home Valuation Report for This Property
The Home Valuation Report is an in-depth analysis detailing your home's value as well as a comparison with similar homes in the area
Home Values in the Area
Average Home Value in this Area
Purchase History
| Date | Buyer | Sale Price | Title Company |
|---|---|---|---|
| Landi Deonna | -- | None Available | |
| Landi Deonna | -- | None Available | |
| Landi Deonna | -- | None Available | |
| Landi Maria I | -- | -- |
Source: Public Records
Mortgage History
| Date | Status | Borrower | Loan Amount |
|---|---|---|---|
| Previous Owner | Landi Maria I | $7,000 | |
| Previous Owner | Landi Maria I | $60,000 | |
| Previous Owner | Landi Maria I | $70,000 |
Source: Public Records
Tax History
| Year | Tax Paid | Tax Assessment Tax Assessment Total Assessment is a certain percentage of the fair market value that is determined by local assessors to be the total taxable value of land and additions on the property. | Land | Improvement |
|---|---|---|---|---|
| 2025 | $4,647 | $159,320 | $31,220 | $128,100 |
| 2024 | $4,340 | $159,320 | $31,220 | $128,100 |
| 2023 | $4,204 | $159,320 | $31,220 | $128,100 |
| 2022 | $3,735 | $111,370 | $22,610 | $88,760 |
| 2021 | $3,735 | $111,370 | $22,610 | $88,760 |
| 2020 | $3,735 | $111,370 | $22,610 | $88,760 |
| 2019 | $3,735 | $111,370 | $22,610 | $88,760 |
| 2018 | $3,735 | $111,370 | $22,610 | $88,760 |
| 2017 | $3,780 | $112,700 | $22,610 | $90,090 |
| 2016 | $3,780 | $112,700 | $22,610 | $90,090 |
| 2015 | $3,685 | $112,700 | $22,610 | $90,090 |
| 2014 | $3,596 | $112,700 | $22,610 | $90,090 |
Source: Public Records
Map
Nearby Homes
Your Personal Tour Guide
Ask me questions while you tour the home.