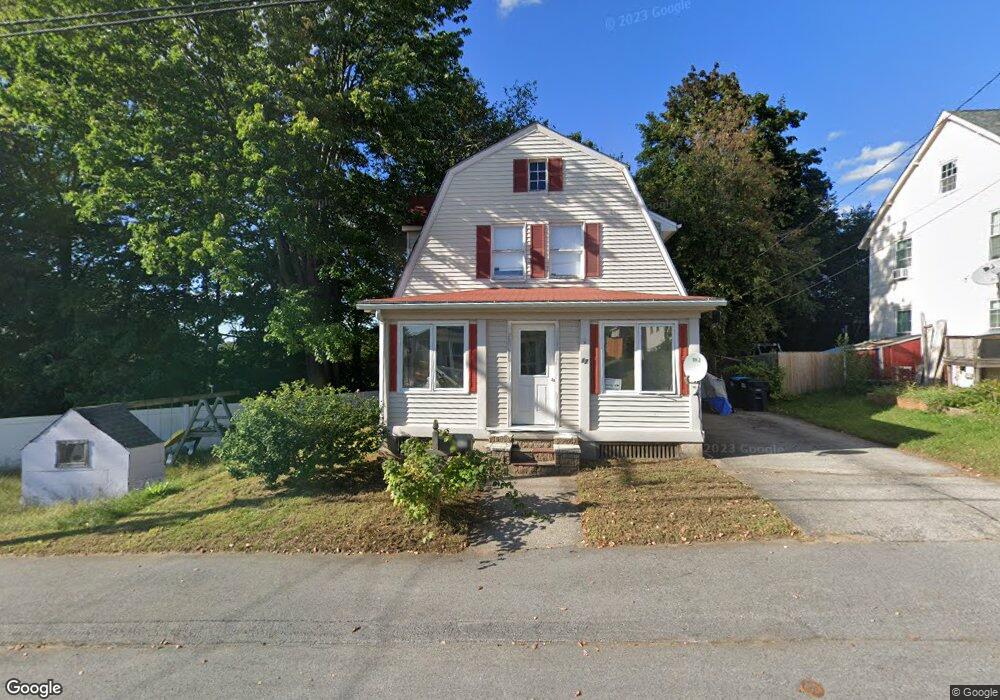
23 Webster St Allenstown, NH 03275
Suncook NeighborhoodEstimated Value: $292,000 - $375,656
2
Beds
2
Baths
968
Sq Ft
$349/Sq Ft
Est. Value
About This Home
This home is located at 23 Webster St, Allenstown, NH 03275 and is currently estimated at $337,664, approximately $348 per square foot. 23 Webster St is a home located in Merrimack County with nearby schools including Allenstown Elementary School, Armand R. Dupont School, and Tender Years Child Care & Learning Center.
Ownership History
Date
Name
Owned For
Owner Type
Purchase Details
Closed on
Nov 29, 2023
Sold by
Nichols Brian
Bought by
Nichols Statia A
Current Estimated Value
Home Financials for this Owner
Home Financials are based on the most recent Mortgage that was taken out on this home.
Original Mortgage
$135,000
Outstanding Balance
$133,005
Interest Rate
7.63%
Mortgage Type
Stand Alone Refi Refinance Of Original Loan
Estimated Equity
$204,659
Purchase Details
Closed on
Sep 8, 2009
Sold by
Giovagnoli Donna L
Bought by
Nichols Brian E and Nichols Statia A
Home Financials for this Owner
Home Financials are based on the most recent Mortgage that was taken out on this home.
Original Mortgage
$144,222
Interest Rate
5.21%
Mortgage Type
Purchase Money Mortgage
Create a Home Valuation Report for This Property
The Home Valuation Report is an in-depth analysis detailing your home's value as well as a comparison with similar homes in the area
Home Values in the Area
Average Home Value in this Area
Purchase History
| Date | Buyer | Sale Price | Title Company |
|---|---|---|---|
| Nichols Statia A | -- | None Available | |
| Nichols Statia A | -- | None Available | |
| Nichols Brian E | $134,300 | -- | |
| Nichols Brian E | $134,300 | -- |
Source: Public Records
Mortgage History
| Date | Status | Borrower | Loan Amount |
|---|---|---|---|
| Open | Nichols Statia A | $135,000 | |
| Previous Owner | Nichols Brian E | $144,222 |
Source: Public Records
Tax History Compared to Growth
Tax History
| Year | Tax Paid | Tax Assessment Tax Assessment Total Assessment is a certain percentage of the fair market value that is determined by local assessors to be the total taxable value of land and additions on the property. | Land | Improvement |
|---|---|---|---|---|
| 2024 | $6,706 | $263,800 | $135,700 | $128,100 |
| 2023 | $5,593 | $263,800 | $135,700 | $128,100 |
| 2022 | $5,144 | $263,800 | $135,700 | $128,100 |
| 2021 | $4,703 | $149,300 | $75,600 | $73,700 |
| 2020 | $4,374 | $149,300 | $75,600 | $73,700 |
| 2019 | $4,643 | $149,300 | $75,600 | $73,700 |
| 2018 | $4,501 | $149,300 | $75,600 | $73,700 |
| 2017 | $4,794 | $149,300 | $75,600 | $73,700 |
| 2016 | $3,962 | $117,000 | $46,700 | $70,300 |
| 2015 | $3,841 | $117,000 | $46,700 | $70,300 |
| 2014 | $3,952 | $117,000 | $46,700 | $70,300 |
| 2013 | $3,689 | $117,000 | $46,700 | $70,300 |
Source: Public Records
Map
Nearby Homes
- 7 Ferry St
- 4 Rodger Rd
- 100 Main St Unit M10
- 100 Main St Unit 204
- 12-14 Church St Unit 12,14
- 15 Main St
- 111 Glass St
- 422 Dawn Dr Unit 23
- 427 Dawn Dr Unit 15
- 1 1/2 Bartlett St
- 233 Pembroke St
- 19 Sullivan Dr
- 259 Pembroke St
- 307 Dearborn Rd
- 10 Lane Dr
- 2 Cheryl Dr
- 10 Winchester Ct
- 15 Sullivan Dr
- 1821 Hooksett Rd
- 347 Pembroke St
- 17 Webster St
- 15 Webster St
- 13 Webster St
- 19 Webster St
- 14 Webster St
- 12 Webster St
- 16 Webster St
- 18 Webster St
- 27 Webster St Unit 29
- 21 Webster St
- 21 Webster St Unit A + B
- 9 Webster St
- 13 Whitten St
- 20 Webster St
- 11 Whitten St
- 9 Whitten St
- 15 Whitten St
- 6 Webster St
- 17 Whitten St
- 5 Whitten St Unit Apartment 1