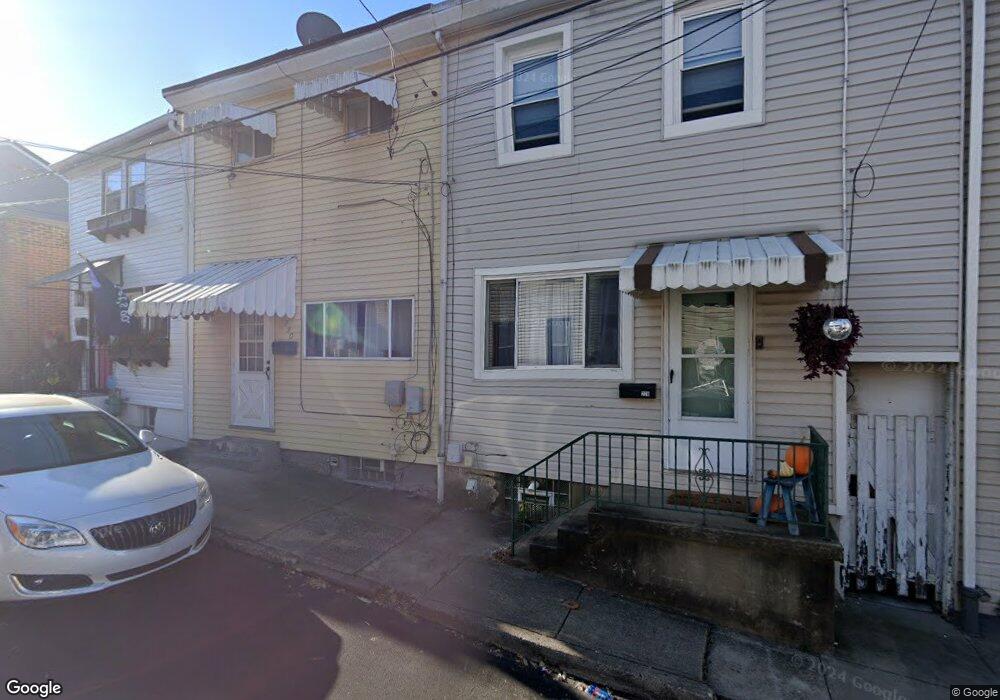
230 42nd St Pittsburgh, PA 15201
Central Lawrenceville NeighborhoodEstimated Value: $221,739 - $367,000
2
Beds
2
Baths
1,054
Sq Ft
$282/Sq Ft
Est. Value
About This Home
This home is located at 230 42nd St, Pittsburgh, PA 15201 and is currently estimated at $297,685, approximately $282 per square foot. 230 42nd St is a home located in Allegheny County with nearby schools including Pittsburgh Arsenal 6-8, Pittsburgh Arsenal K-5, and Pittsburgh Milliones 6-12.
Ownership History
Date
Name
Owned For
Owner Type
Purchase Details
Closed on
Nov 4, 2016
Sold by
Kvortek Gerald J
Bought by
Eoan Development Llc
Current Estimated Value
Purchase Details
Closed on
Jun 2, 2005
Sold by
Givens Michael Sean
Bought by
Kvortek Gerald J
Home Financials for this Owner
Home Financials are based on the most recent Mortgage that was taken out on this home.
Original Mortgage
$57,000
Interest Rate
5.83%
Mortgage Type
FHA
Purchase Details
Closed on
Mar 10, 2003
Sold by
Chelkowski Harriet M
Bought by
Givens Debra A and Golubski Donald F
Create a Home Valuation Report for This Property
The Home Valuation Report is an in-depth analysis detailing your home's value as well as a comparison with similar homes in the area
Home Values in the Area
Average Home Value in this Area
Purchase History
| Date | Buyer | Sale Price | Title Company |
|---|---|---|---|
| Eoan Development Llc | $65,000 | Attorney | |
| Kvortek Gerald J | $57,000 | -- | |
| Givens Debra A | -- | -- |
Source: Public Records
Mortgage History
| Date | Status | Borrower | Loan Amount |
|---|---|---|---|
| Previous Owner | Kvortek Gerald J | $57,000 |
Source: Public Records
Tax History
| Year | Tax Paid | Tax Assessment Tax Assessment Total Assessment is a certain percentage of the fair market value that is determined by local assessors to be the total taxable value of land and additions on the property. | Land | Improvement |
|---|---|---|---|---|
| 2025 | $1,306 | $56,700 | $15,400 | $41,300 |
| 2024 | $1,306 | $56,700 | $15,400 | $41,300 |
| 2023 | $1,306 | $56,700 | $15,400 | $41,300 |
| 2022 | $1,289 | $56,700 | $15,400 | $41,300 |
| 2021 | $1,304 | $56,700 | $15,400 | $41,300 |
| 2020 | $1,283 | $56,700 | $15,400 | $41,300 |
| 2019 | $1,283 | $56,700 | $15,400 | $41,300 |
| 2017 | $1,283 | $56,700 | $15,400 | $41,300 |
Source: Public Records
Map
Nearby Homes
Your Personal Tour Guide
Ask me questions while you tour the home.