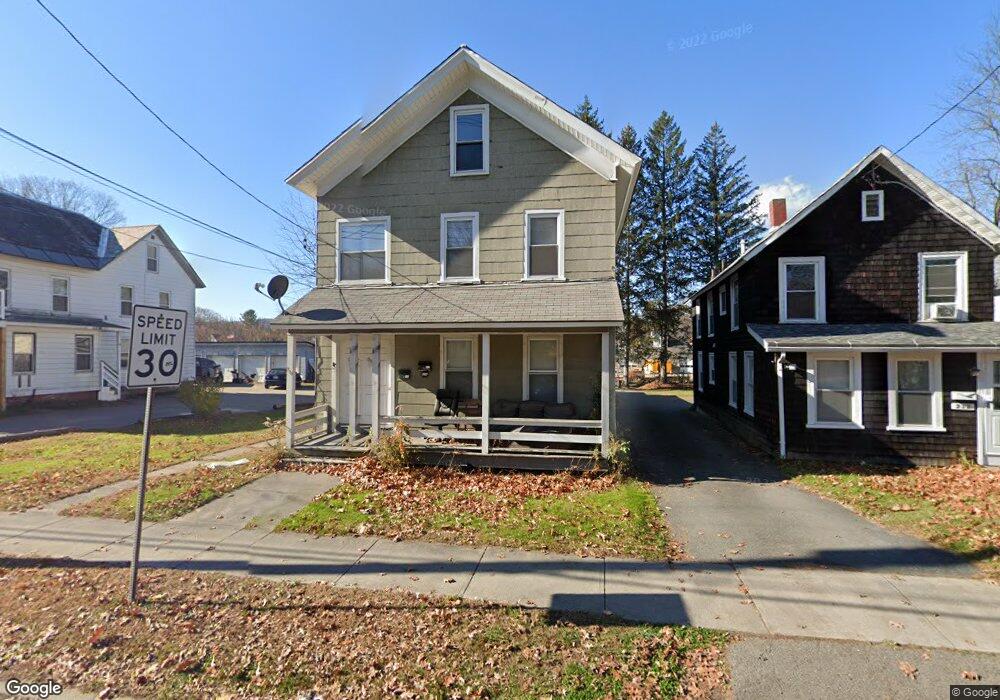
230 Chapman St Greenfield, MA 01301
Estimated Value: $248,000 - $348,176
6
Beds
2
Baths
1,832
Sq Ft
$151/Sq Ft
Est. Value
About This Home
This home is located at 230 Chapman St, Greenfield, MA 01301 and is currently estimated at $276,794, approximately $151 per square foot. 230 Chapman St is a home located in Franklin County with nearby schools including Cornerstone Christian School and Holy Trinity School.
Ownership History
Date
Name
Owned For
Owner Type
Purchase Details
Closed on
Nov 25, 2015
Sold by
Werner Kevin A
Bought by
Werner Kevin A and Werner Sharon E
Current Estimated Value
Purchase Details
Closed on
Feb 28, 1995
Sold by
United Sb
Bought by
Werner Kevin A and Werner Annette E
Home Financials for this Owner
Home Financials are based on the most recent Mortgage that was taken out on this home.
Original Mortgage
$76,760
Interest Rate
9.17%
Mortgage Type
Purchase Money Mortgage
Purchase Details
Closed on
Dec 23, 1994
Sold by
Houle Sharon A
Bought by
United Sb
Purchase Details
Closed on
Oct 2, 1987
Sold by
Singley Edward J
Bought by
Haven-Sullivan Dev Crp
Create a Home Valuation Report for This Property
The Home Valuation Report is an in-depth analysis detailing your home's value as well as a comparison with similar homes in the area
Home Values in the Area
Average Home Value in this Area
Purchase History
| Date | Buyer | Sale Price | Title Company |
|---|---|---|---|
| Werner Kevin A | -- | -- | |
| Werner Kevin A | -- | -- | |
| Werner Kevin A | $35,000 | -- | |
| Werner Kevin A | $35,000 | -- | |
| United Sb | $76,768 | -- | |
| United Sb | $76,768 | -- | |
| Haven-Sullivan Dev Crp | $89,500 | -- |
Source: Public Records
Mortgage History
| Date | Status | Borrower | Loan Amount |
|---|---|---|---|
| Previous Owner | Haven-Sullivan Dev Crp | $74,000 | |
| Previous Owner | Haven-Sullivan Dev Crp | $76,760 |
Source: Public Records
Tax History Compared to Growth
Tax History
| Year | Tax Paid | Tax Assessment Tax Assessment Total Assessment is a certain percentage of the fair market value that is determined by local assessors to be the total taxable value of land and additions on the property. | Land | Improvement |
|---|---|---|---|---|
| 2025 | $4,816 | $246,200 | $62,600 | $183,600 |
| 2024 | $4,739 | $232,400 | $50,200 | $182,200 |
| 2023 | $4,128 | $210,100 | $50,200 | $159,900 |
| 2022 | $3,884 | $174,000 | $45,500 | $128,500 |
| 2021 | $3,743 | $161,200 | $45,200 | $116,000 |
| 2020 | $3,602 | $157,100 | $41,100 | $116,000 |
| 2019 | $3,392 | $151,700 | $35,700 | $116,000 |
| 2018 | $3,329 | $148,400 | $35,000 | $113,400 |
| 2017 | $3,225 | $148,400 | $35,000 | $113,400 |
| 2016 | $3,285 | $150,600 | $33,700 | $116,900 |
| 2015 | $3,217 | $142,900 | $37,700 | $105,200 |
| 2014 | $2,942 | $143,300 | $37,700 | $105,600 |
Source: Public Records
Map
Nearby Homes
- 232 Chapman St
- 232-234 Chapman St
- 226 Chapman St Unit 228
- 226-228 Chapman St
- 234 Chapman St
- 228 Chapman St
- 236 Chapman St
- 222 Chapman St Unit 224
- 229 Chapman St Unit 231
- 220 Chapman St
- 233 Chapman St
- 227 Chapman St
- 237 Chapman St
- 223 Chapman St
- 216 Chapman St
- 242 Chapman St
- 221 Chapman St
- 243 Chapman St
- 241 Chapman St
- 217 Chapman St