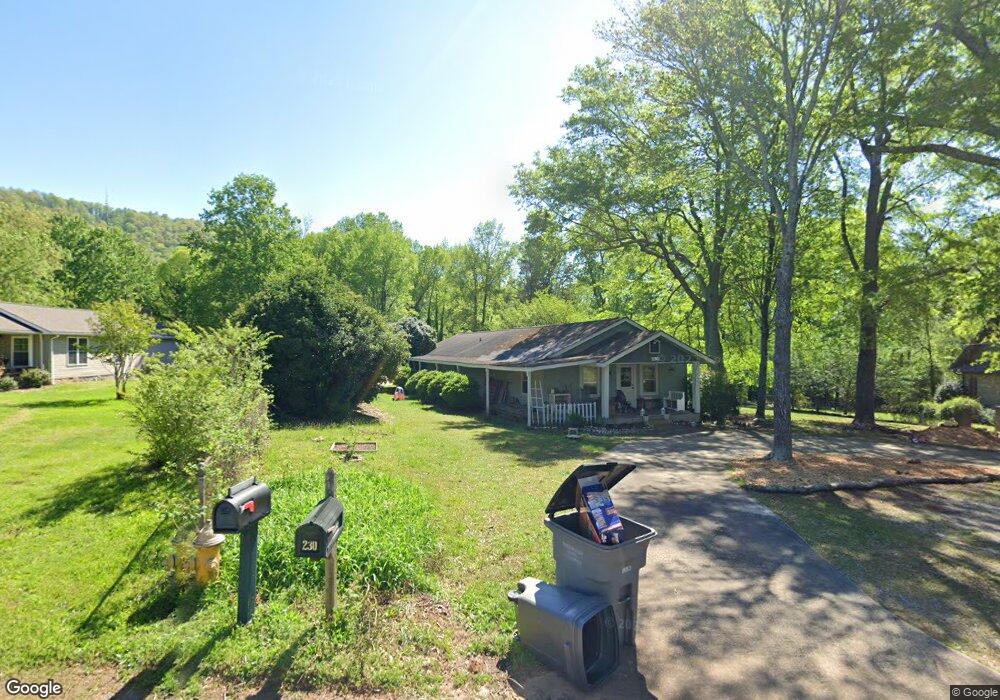
230 Davidson Rd Greenville, SC 29609
Estimated Value: $161,000 - $439,000
2
Beds
2
Baths
1,850
Sq Ft
$184/Sq Ft
Est. Value
About This Home
This home is located at 230 Davidson Rd, Greenville, SC 29609 and is currently estimated at $340,730, approximately $184 per square foot. 230 Davidson Rd is a home located in Greenville County with nearby schools including Duncan Chapel Elementary, Lakeview Middle, and Travelers Rest High School.
Ownership History
Date
Name
Owned For
Owner Type
Purchase Details
Closed on
Feb 14, 2022
Sold by
Great Commission Inc
Bought by
Johnson Joel Daniel and Johnson Ann Rylee
Current Estimated Value
Home Financials for this Owner
Home Financials are based on the most recent Mortgage that was taken out on this home.
Original Mortgage
$101,037
Outstanding Balance
$93,821
Interest Rate
3.55%
Mortgage Type
New Conventional
Estimated Equity
$246,909
Purchase Details
Closed on
Jun 13, 2014
Sold by
The Great Commission Inc
Bought by
The Phillip J Sterr Living Trust
Purchase Details
Closed on
Mar 25, 2014
Sold by
The Evangelical Institute Of Greenville
Bought by
The Great Commission Inc
Purchase Details
Closed on
Feb 28, 2013
Sold by
Sterr Phillip J and Sterr Margaret J
Bought by
Sterr Phillip J and Sterr Margaret J
Purchase Details
Closed on
Jul 31, 2008
Sold by
The Great Commission Inc
Bought by
Sterr Phillip J and Sterr Margaret J
Create a Home Valuation Report for This Property
The Home Valuation Report is an in-depth analysis detailing your home's value as well as a comparison with similar homes in the area
Home Values in the Area
Average Home Value in this Area
Purchase History
| Date | Buyer | Sale Price | Title Company |
|---|---|---|---|
| Johnson Joel Daniel | $100,000 | None Listed On Document | |
| The Phillip J Sterr Living Trust | $27,000 | -- | |
| The Great Commission Inc | -- | -- | |
| Sterr Phillip J | -- | -- | |
| Sterr Phillip J | $150,000 | -- |
Source: Public Records
Mortgage History
| Date | Status | Borrower | Loan Amount |
|---|---|---|---|
| Open | Johnson Joel Daniel | $101,037 |
Source: Public Records
Tax History Compared to Growth
Tax History
| Year | Tax Paid | Tax Assessment Tax Assessment Total Assessment is a certain percentage of the fair market value that is determined by local assessors to be the total taxable value of land and additions on the property. | Land | Improvement |
|---|---|---|---|---|
| 2024 | $1,335 | $4,850 | $1,670 | $3,180 |
| 2023 | $1,335 | $7,280 | $2,510 | $4,770 |
| 2022 | $210 | $4,847 | $1,670 | $3,177 |
| 2021 | $210 | $0 | $0 | $0 |
| 2020 | $225 | $0 | $0 | $0 |
| 2019 | $225 | $0 | $0 | $0 |
| 2018 | $165 | $0 | $0 | $0 |
| 2017 | $165 | $0 | $0 | $0 |
| 2016 | $150 | $112,910 | $37,660 | $75,250 |
| 2015 | $150 | $112,910 | $37,660 | $75,250 |
| 2014 | $150 | $128,265 | $56,128 | $72,137 |
Source: Public Records
Map
Nearby Homes
- 1304 N Parker Rd
- 160 Mountain Brook Trail
- 1314 N Parker Rd
- 9 Mauldin Cir
- 967 Altamont Rd
- 902 Altamont Rd
- 30 Mauldin Cir
- 239 Phillips Trail
- 19287 Patrol Club Rd
- 0 Altamont Rd Unit Part lot 5/6 1553999
- 115 Viewmont Dr
- 00 Old Rockhouse Rd
- 0 Old Rockhouse Rd
- 46 Mardale Ln
- 117 Laurel Ridge
- 51 Mardale Ln
- 4 Diby Dr
- 71 Mardale Ln
- 20 Mardale Ln
- 0 Chestnut Ridge Rd Unit 1566054
- 302 Davidson Rd
- 226 Davidson Rd
- 304 Davidson Rd
- 222 Davidson Rd
- 307 Davidson Rd
- 307 Davidson Rd
- 223 Davidson Rd
- 311 Davidson Rd
- 309 Davidson Rd
- 308 Davidson Rd
- 221 Davidson Rd
- 320 Davidson Rd
- 0 Lehman Moseley Ridge
- 326 Davidson Rd
- 8B Lehman Moseley Ridge
- 14 Lehman Moseley Ridge
- 13 Lehman Moseley Ridge
- 218 Davidson Rd
- 220 Davidson Rd
- 805 N Parker Rd