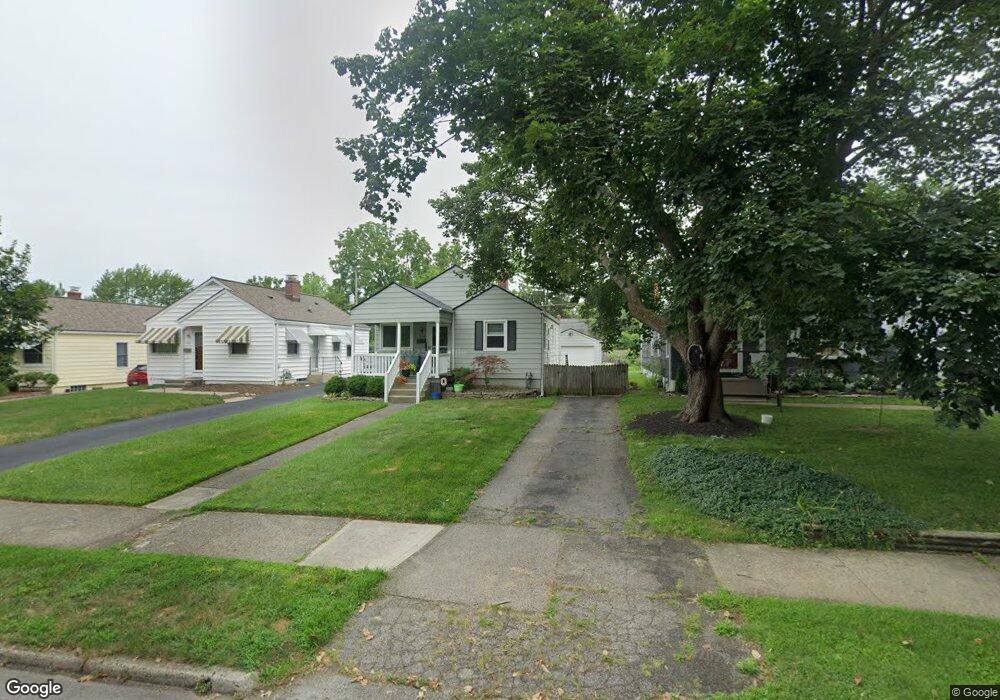
230 E Jeffrey Place Columbus, OH 43214
Clintonville NeighborhoodEstimated Value: $275,592 - $320,000
4
Beds
4
Baths
2,579
Sq Ft
$115/Sq Ft
Est. Value
About This Home
This home is located at 230 E Jeffrey Place, Columbus, OH 43214 and is currently estimated at $296,148, approximately $114 per square foot. 230 E Jeffrey Place is a home located in Franklin County with nearby schools including Indian Springs Elementary School, Dominion Middle School, and Whetstone High School.
Ownership History
Date
Name
Owned For
Owner Type
Purchase Details
Closed on
Nov 26, 2003
Sold by
Denning James W and Denning Diane L
Bought by
Paxton Traci J
Current Estimated Value
Home Financials for this Owner
Home Financials are based on the most recent Mortgage that was taken out on this home.
Original Mortgage
$97,200
Outstanding Balance
$40,459
Interest Rate
4.87%
Mortgage Type
Purchase Money Mortgage
Estimated Equity
$255,689
Purchase Details
Closed on
Dec 5, 1995
Sold by
Payton Christine E
Bought by
Denning James W and Denning Dianne L
Home Financials for this Owner
Home Financials are based on the most recent Mortgage that was taken out on this home.
Original Mortgage
$65,000
Interest Rate
7.44%
Mortgage Type
New Conventional
Purchase Details
Closed on
Jul 19, 1994
Sold by
Davis Tawny J
Bought by
Christine E Payton
Home Financials for this Owner
Home Financials are based on the most recent Mortgage that was taken out on this home.
Original Mortgage
$71,550
Interest Rate
8.6%
Mortgage Type
FHA
Purchase Details
Closed on
Nov 27, 1991
Create a Home Valuation Report for This Property
The Home Valuation Report is an in-depth analysis detailing your home's value as well as a comparison with similar homes in the area
Home Values in the Area
Average Home Value in this Area
Purchase History
| Date | Buyer | Sale Price | Title Company |
|---|---|---|---|
| Paxton Traci J | $121,500 | Real Living Title | |
| Denning James W | $85,000 | -- | |
| Christine E Payton | $81,500 | -- | |
| -- | $66,500 | -- |
Source: Public Records
Mortgage History
| Date | Status | Borrower | Loan Amount |
|---|---|---|---|
| Open | Paxton Traci J | $97,200 | |
| Previous Owner | Denning James W | $65,000 | |
| Previous Owner | Christine E Payton | $71,550 |
Source: Public Records
Tax History
| Year | Tax Paid | Tax Assessment Tax Assessment Total Assessment is a certain percentage of the fair market value that is determined by local assessors to be the total taxable value of land and additions on the property. | Land | Improvement |
|---|---|---|---|---|
| 2025 | $3,806 | $84,810 | $41,300 | $43,510 |
| 2024 | $3,806 | $84,810 | $41,300 | $43,510 |
| 2023 | $3,758 | $84,805 | $41,300 | $43,505 |
| 2022 | $3,537 | $68,190 | $25,030 | $43,160 |
| 2021 | $3,543 | $68,190 | $25,030 | $43,160 |
| 2020 | $3,548 | $68,190 | $25,030 | $43,160 |
| 2019 | $3,164 | $52,150 | $19,250 | $32,900 |
| 2018 | $2,853 | $52,150 | $19,250 | $32,900 |
| 2017 | $3,162 | $52,150 | $19,250 | $32,900 |
| 2016 | $2,808 | $42,390 | $16,100 | $26,290 |
| 2015 | $2,549 | $42,390 | $16,100 | $26,290 |
| 2014 | $2,555 | $42,390 | $16,100 | $26,290 |
| 2013 | $1,200 | $40,355 | $15,330 | $25,025 |
Source: Public Records
Map
Nearby Homes
- 327 E Jeffrey Place
- 522 E Beechwold Blvd
- 528 E Beechwold Blvd
- 151 W Dominion Blvd
- 243 E Schreyer Place
- 262 Leland Ave
- 33 Rosslyn Ave
- 68 W Kanawha Ave
- 4615 Glenmawr Ave
- 4605 Glenmawr Ave
- 211 Garrett Place
- 109 W Schreyer Place
- 131 E Stanton Ave
- 5200 Fenway Ct Unit B
- 119 E Lincoln Ave
- 139 Aldrich Rd
- 252 W Kanawha Ave
- 131 Broad Meadows Blvd
- 5301 Indianola Ave
- 468 E Lincoln Ave
- 226 E Jeffrey Place
- 236 E Jeffrey Place
- 242 E Jeffrey Place
- 220 E Jeffrey Place
- 214 E Jeffrey Place
- 229 Morse Rd
- 235 Morse Rd
- 223 Morse Rd
- 241 Morse Rd
- 210 E Jeffrey Place
- 252 E Jeffrey Place
- 252 E Jeffrey Place
- 219 Morse Rd
- 229 E Jeffrey Place
- 245 Morse Rd
- 235 E Jeffrey Place
- 213 Morse Rd
- 225 E Jeffrey Place
- 204 E Jeffrey Place
- 258 E Jeffrey Place
Your Personal Tour Guide
Ask me questions while you tour the home.