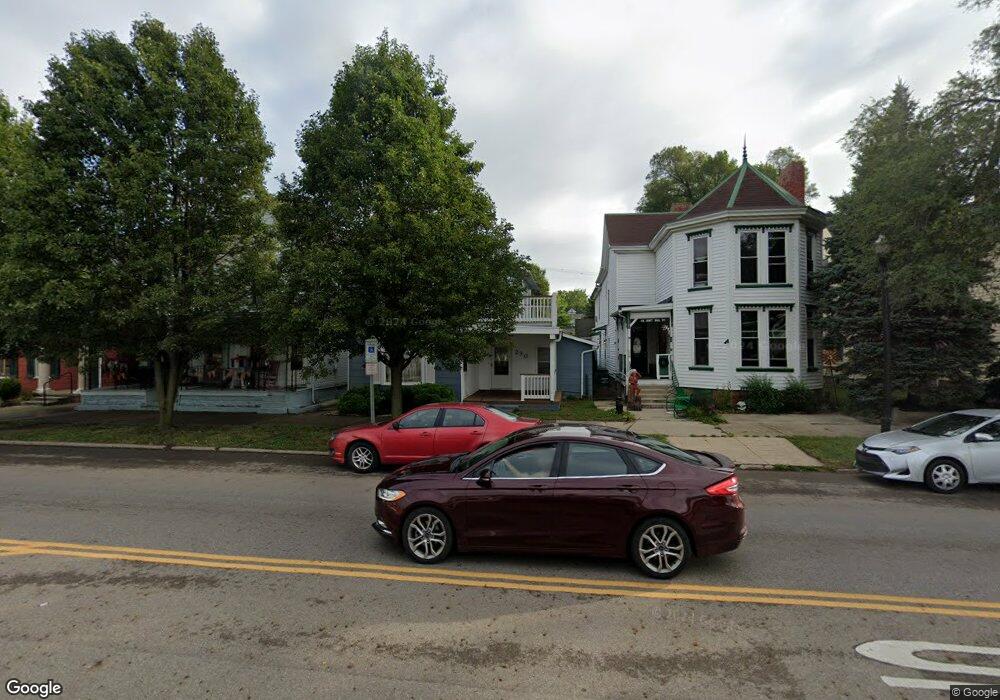
230 E Main St Circleville, OH 43113
Estimated Value: $187,000 - $256,000
3
Beds
3
Baths
2,596
Sq Ft
$87/Sq Ft
Est. Value
About This Home
This home is located at 230 E Main St, Circleville, OH 43113 and is currently estimated at $226,864, approximately $87 per square foot. 230 E Main St is a home located in Pickaway County with nearby schools including Circleville High School, Crossroads Christian Academy, and New Hope Christian Academy.
Ownership History
Date
Name
Owned For
Owner Type
Purchase Details
Closed on
Feb 7, 2006
Sold by
Schaal Donald D and Schaal Beverly A
Bought by
Schaal Donald D and Schaal Beverly A
Current Estimated Value
Purchase Details
Closed on
Oct 6, 2005
Sold by
Estate Of Jason M Schaal
Bought by
Schaal Beverly A and Schaal Donald D
Purchase Details
Closed on
Nov 8, 2001
Sold by
Hill Juanita L
Bought by
Schaal Jason M
Home Financials for this Owner
Home Financials are based on the most recent Mortgage that was taken out on this home.
Original Mortgage
$101,000
Interest Rate
6.72%
Mortgage Type
New Conventional
Purchase Details
Closed on
Dec 1, 1989
Purchase Details
Closed on
Apr 1, 1986
Create a Home Valuation Report for This Property
The Home Valuation Report is an in-depth analysis detailing your home's value as well as a comparison with similar homes in the area
Home Values in the Area
Average Home Value in this Area
Purchase History
| Date | Buyer | Sale Price | Title Company |
|---|---|---|---|
| Schaal Donald D | -- | None Available | |
| Schaal Beverly A | -- | None Available | |
| Schaal Jason M | $100,000 | -- | |
| -- | $56,000 | -- | |
| -- | $18,000 | -- |
Source: Public Records
Mortgage History
| Date | Status | Borrower | Loan Amount |
|---|---|---|---|
| Previous Owner | Schaal Jason M | $101,000 |
Source: Public Records
Tax History
| Year | Tax Paid | Tax Assessment Tax Assessment Total Assessment is a certain percentage of the fair market value that is determined by local assessors to be the total taxable value of land and additions on the property. | Land | Improvement |
|---|---|---|---|---|
| 2025 | $4,356 | $57,510 | $7,790 | $49,720 |
| 2024 | $4,356 | $57,510 | $7,790 | $49,720 |
| 2023 | $2,073 | $57,510 | $7,790 | $49,720 |
| 2022 | $2,074 | $45,690 | $6,520 | $39,170 |
| 2021 | $2,087 | $45,690 | $6,520 | $39,170 |
| 2020 | $2,087 | $45,690 | $6,520 | $39,170 |
| 2019 | $1,879 | $38,020 | $6,520 | $31,500 |
| 2018 | $1,907 | $38,020 | $6,520 | $31,500 |
| 2017 | $1,893 | $38,020 | $6,520 | $31,500 |
| 2016 | $1,784 | $35,290 | $7,130 | $28,160 |
| 2015 | $1,786 | $35,290 | $7,130 | $28,160 |
| 2014 | $1,779 | $35,290 | $7,130 | $28,160 |
| 2013 | $1,947 | $38,020 | $7,130 | $30,890 |
Source: Public Records
Map
Nearby Homes
- 125 N Pickaway St
- 405 Watt St
- 378 E Franklin St
- 416 Stella Ave
- 430 Ruth Ave
- 321 S Pickaway St
- 0 Ohio 56 Unit 226002334
- 446 E Franklin St
- 157 W High St
- 461 Watt St
- 461 N Court St
- 474 N Court St
- 231 Westwood Dr
- 550 Springhollow Rd
- 575 Renick Ave
- 531 E Franklin St
- 528 N Court St
- 551 E Main St
- 561 Springhollow Rd
- 134 Rosewood Ave
- 228 E Main St
- 226 E Main St
- 238 E Main St
- 115 N Washington St
- 222 E Main St
- 119 N Washington St
- 223 Watt St
- 302 E Main St
- 114 N Washington St
- 217 Watt St
- 231 Watt St
- 229 Watt St
- 235 Watt St
- 118 N Washington St
- 219 E Main St
- 227 Watt St
- 120 N Pickaway St
- 310 E Main St
- 120 N Washington St
- 128 N Pickaway St
Your Personal Tour Guide
Ask me questions while you tour the home.