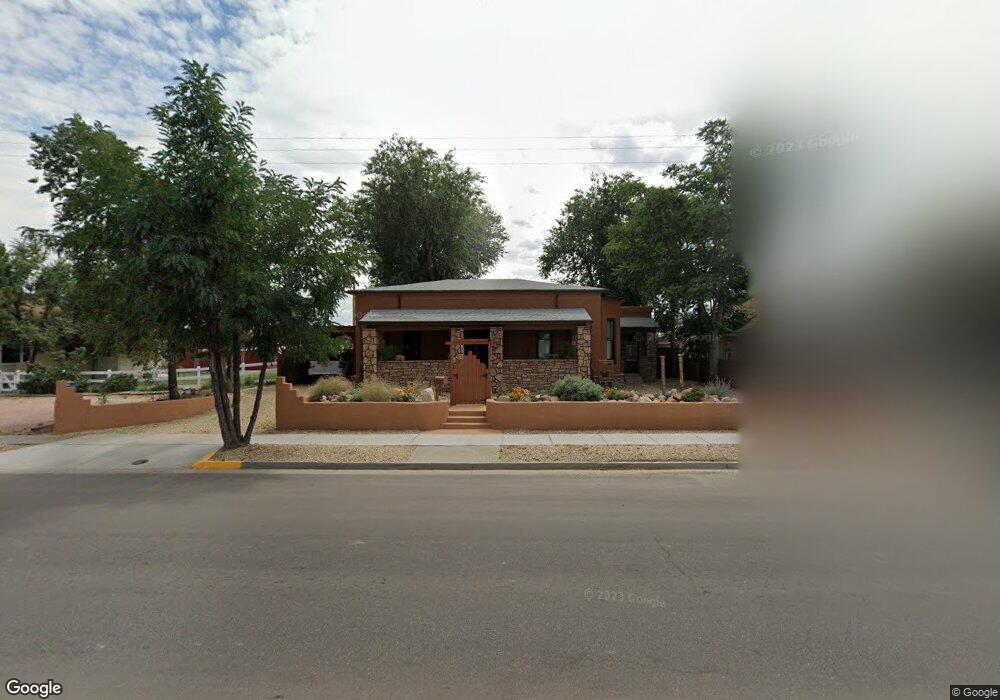
230 E Main St Florence, CO 81226
Estimated Value: $299,336 - $410,000
3
Beds
3
Baths
2,209
Sq Ft
$162/Sq Ft
Est. Value
About This Home
This home is located at 230 E Main St, Florence, CO 81226 and is currently estimated at $357,334, approximately $161 per square foot. 230 E Main St is a home located in Fremont County with nearby schools including Fremont Elementary School, Florence High School, and Florence Christian School.
Ownership History
Date
Name
Owned For
Owner Type
Purchase Details
Closed on
May 9, 2019
Sold by
Severino Linda P
Bought by
Renner Ronnie G and Renner Bonita G
Current Estimated Value
Home Financials for this Owner
Home Financials are based on the most recent Mortgage that was taken out on this home.
Original Mortgage
$255,550
Outstanding Balance
$220,894
Interest Rate
4%
Mortgage Type
New Conventional
Estimated Equity
$136,440
Purchase Details
Closed on
Jan 6, 2017
Sold by
Jones Alinda
Bought by
Severino Linda P
Purchase Details
Closed on
Nov 19, 2007
Sold by
Jones Alinda
Bought by
Jones Alinmda
Create a Home Valuation Report for This Property
The Home Valuation Report is an in-depth analysis detailing your home's value as well as a comparison with similar homes in the area
Home Values in the Area
Average Home Value in this Area
Tax History
| Year | Tax Paid | Tax Assessment Tax Assessment Total Assessment is a certain percentage of the fair market value that is determined by local assessors to be the total taxable value of land and additions on the property. | Land | Improvement |
|---|---|---|---|---|
| 2025 | $1,790 | $22,573 | -- | -- |
| 2024 | $1,790 | $22,154 | $0 | $0 |
| 2023 | $1,472 | $18,469 | $0 | $0 |
| 2022 | $1,450 | $18,337 | $0 | $0 |
| 2021 | $1,471 | $18,865 | $0 | $0 |
| 2020 | $1,054 | $15,611 | $0 | $0 |
| 2019 | $1,064 | $15,611 | $0 | $0 |
| 2018 | $460 | $6,829 | $0 | $0 |
| 2017 | $271 | $3,971 | $0 | $0 |
| 2016 | $269 | $3,940 | $0 | $0 |
| 2015 | $266 | $3,940 | $0 | $0 |
| 2012 | $293 | $3,960 | $1,950 | $2,010 |
Source: Public Records
Map
Nearby Homes
Your Personal Tour Guide
Ask me questions while you tour the home.