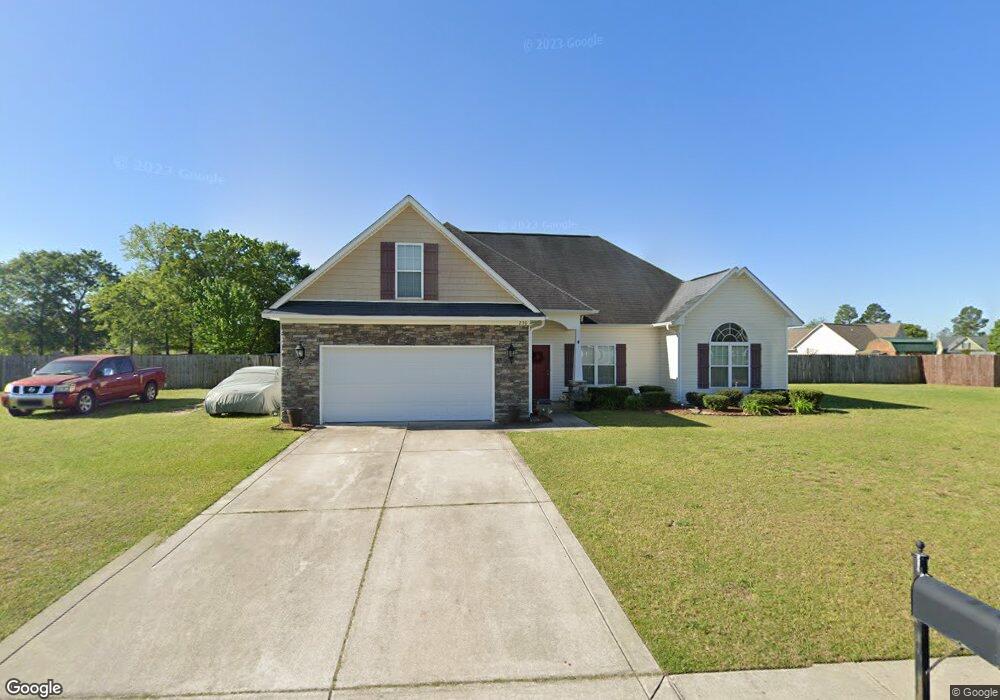
230 Gatsby Dr Raeford, NC 28376
Estimated Value: $270,006 - $282,000
3
Beds
2
Baths
1,710
Sq Ft
$161/Sq Ft
Est. Value
About This Home
This home is located at 230 Gatsby Dr, Raeford, NC 28376 and is currently estimated at $276,002, approximately $161 per square foot. 230 Gatsby Dr is a home located in Hoke County with nearby schools including Scurlock Elementary School, Sandy Grove Middle School, and Hoke County High.
Ownership History
Date
Name
Owned For
Owner Type
Purchase Details
Closed on
Mar 13, 2017
Sold by
Secretary Of Hud
Bought by
Baker Stephen
Current Estimated Value
Purchase Details
Closed on
Sep 22, 2016
Sold by
Pennymac Loan Services Llc
Bought by
Secretary Of Veterans Affairs
Purchase Details
Closed on
Sep 20, 2016
Sold by
Poe Aaron W and Poe Dominique N
Bought by
Pennymac Loan Services Llc
Purchase Details
Closed on
Apr 18, 2014
Sold by
Poe Dominique Nicole
Bought by
Poe Aaron Wayne
Purchase Details
Closed on
Feb 8, 2014
Sold by
Poe Aaron W
Bought by
Poe Dominique Nicole
Purchase Details
Closed on
Feb 4, 2010
Sold by
Hcc Investments Llc
Bought by
Poe Aaron W and Poe Dominique N
Home Financials for this Owner
Home Financials are based on the most recent Mortgage that was taken out on this home.
Original Mortgage
$174,473
Interest Rate
5.02%
Create a Home Valuation Report for This Property
The Home Valuation Report is an in-depth analysis detailing your home's value as well as a comparison with similar homes in the area
Home Values in the Area
Average Home Value in this Area
Purchase History
| Date | Buyer | Sale Price | Title Company |
|---|---|---|---|
| Baker Stephen | -- | None Available | |
| Secretary Of Veterans Affairs | -- | None Available | |
| Pennymac Loan Services Llc | $127,756 | None Available | |
| Poe Aaron Wayne | -- | None Available | |
| Poe Dominique Nicole | -- | None Available | |
| Poe Aaron W | $169,000 | -- |
Source: Public Records
Mortgage History
| Date | Status | Borrower | Loan Amount |
|---|---|---|---|
| Previous Owner | Poe Aaron W | $174,473 |
Source: Public Records
Tax History Compared to Growth
Tax History
| Year | Tax Paid | Tax Assessment Tax Assessment Total Assessment is a certain percentage of the fair market value that is determined by local assessors to be the total taxable value of land and additions on the property. | Land | Improvement |
|---|---|---|---|---|
| 2025 | $1,760 | $201,220 | $24,000 | $177,220 |
| 2024 | $1,760 | $201,220 | $24,000 | $177,220 |
| 2023 | $1,760 | $201,220 | $24,000 | $177,220 |
| 2022 | $1,727 | $201,220 | $24,000 | $177,220 |
| 2021 | $1,531 | $172,180 | $24,000 | $148,180 |
| 2020 | $1,557 | $172,180 | $24,000 | $148,180 |
| 2019 | $1,557 | $172,180 | $24,000 | $148,180 |
| 2018 | $1,557 | $172,180 | $24,000 | $148,180 |
| 2017 | $1,557 | $172,180 | $24,000 | $148,180 |
| 2016 | $1,529 | $172,180 | $24,000 | $148,180 |
| 2015 | $1,529 | $172,180 | $24,000 | $148,180 |
| 2014 | $1,505 | $172,180 | $24,000 | $148,180 |
| 2013 | -- | $149,440 | $30,000 | $119,440 |
Source: Public Records
Map
Nearby Homes