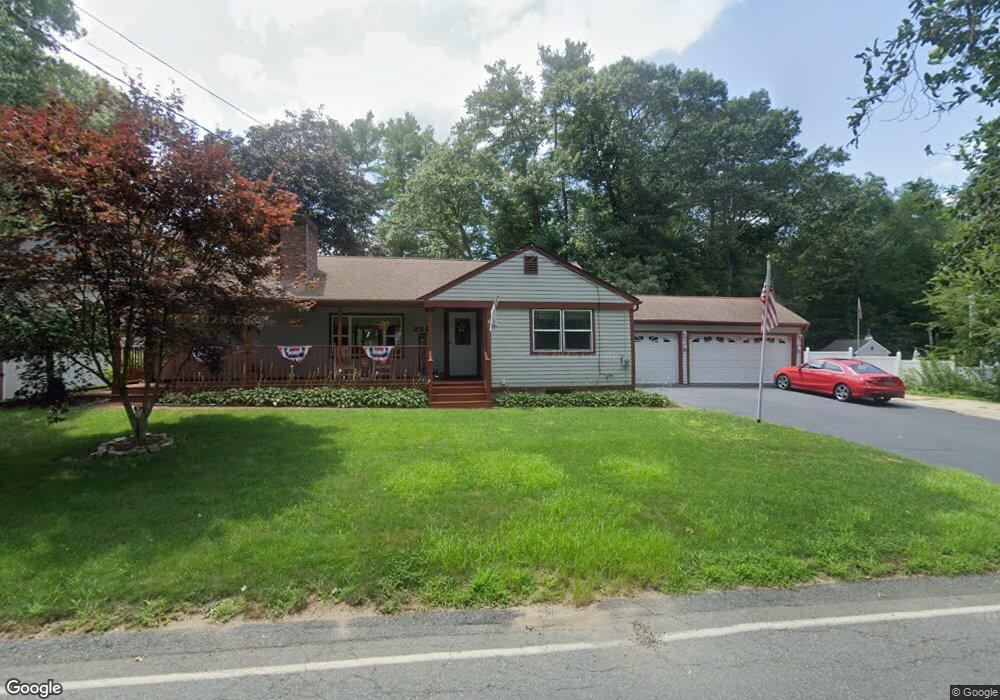
230 Hamlin St Acushnet, MA 02743
Upper Acushnet NeighborhoodEstimated Value: $438,000 - $466,821
3
Beds
2
Baths
1,306
Sq Ft
$349/Sq Ft
Est. Value
About This Home
This home is located at 230 Hamlin St, Acushnet, MA 02743 and is currently estimated at $455,955, approximately $349 per square foot. 230 Hamlin St is a home located in Bristol County with nearby schools including Acushnet Elementary School, Albert F Ford Middle School, and Alma del Mar Charter School.
Ownership History
Date
Name
Owned For
Owner Type
Purchase Details
Closed on
Aug 16, 1999
Sold by
Olson Ventures Inc
Bought by
Demelo Manuel R and Demelo Debra M
Current Estimated Value
Home Financials for this Owner
Home Financials are based on the most recent Mortgage that was taken out on this home.
Original Mortgage
$99,200
Outstanding Balance
$28,507
Interest Rate
7.65%
Mortgage Type
Purchase Money Mortgage
Estimated Equity
$427,448
Purchase Details
Closed on
Feb 8, 1999
Sold by
Foley Patrick E and Fairbanks Capital Corp
Bought by
Olson Ventures Inc
Purchase Details
Closed on
Mar 29, 1990
Sold by
Wall Lillian A
Bought by
Foley Patrick E
Home Financials for this Owner
Home Financials are based on the most recent Mortgage that was taken out on this home.
Original Mortgage
$94,900
Interest Rate
9.96%
Mortgage Type
Purchase Money Mortgage
Create a Home Valuation Report for This Property
The Home Valuation Report is an in-depth analysis detailing your home's value as well as a comparison with similar homes in the area
Home Values in the Area
Average Home Value in this Area
Purchase History
| Date | Buyer | Sale Price | Title Company |
|---|---|---|---|
| Demelo Manuel R | $124,000 | -- | |
| Olson Ventures Inc | $94,300 | -- | |
| Foley Patrick E | $124,900 | -- | |
| Foley Patrick E | $124,900 | -- |
Source: Public Records
Mortgage History
| Date | Status | Borrower | Loan Amount |
|---|---|---|---|
| Open | Foley Patrick E | $99,200 | |
| Previous Owner | Foley Patrick E | $30,000 | |
| Previous Owner | Foley Patrick E | $90,750 | |
| Previous Owner | Foley Patrick E | $94,900 |
Source: Public Records
Tax History
| Year | Tax Paid | Tax Assessment Tax Assessment Total Assessment is a certain percentage of the fair market value that is determined by local assessors to be the total taxable value of land and additions on the property. | Land | Improvement |
|---|---|---|---|---|
| 2025 | $45 | $415,000 | $130,600 | $284,400 |
| 2024 | $4,308 | $377,600 | $123,700 | $253,900 |
| 2023 | $4,241 | $353,400 | $112,300 | $241,100 |
| 2022 | $4,252 | $320,400 | $105,400 | $215,000 |
| 2021 | $3,191 | $299,400 | $105,400 | $194,000 |
| 2020 | $5,043 | $292,500 | $98,500 | $194,000 |
| 2019 | $3,038 | $277,600 | $93,900 | $183,700 |
| 2018 | $3,826 | $265,300 | $93,900 | $171,400 |
| 2017 | $3,715 | $257,300 | $93,900 | $163,400 |
| 2016 | $3,634 | $250,100 | $93,900 | $156,200 |
| 2015 | $3,461 | $242,400 | $93,900 | $148,500 |
Source: Public Records
Map
Nearby Homes
- 25 Pershing Ave
- 23 Oliveira Ave
- 363 Main St
- 7 Hamlin St
- 12 White St
- 23 Coury Dr
- 329 Middle Rd
- 11 Boylston St
- 27 Meadow Ln
- 0 Hathaway Rd Unit 73469544
- 489 Main St
- 15 Ball St
- 14 Hayes St Unit 1
- 12 Hayes St Unit 1
- 65 Armsby St
- 134 Nyes Ln
- 1027 Kenmore St
- 279 Adelaide St
- 34 Chicopee St
- 1077 Shelburne St
Your Personal Tour Guide
Ask me questions while you tour the home.