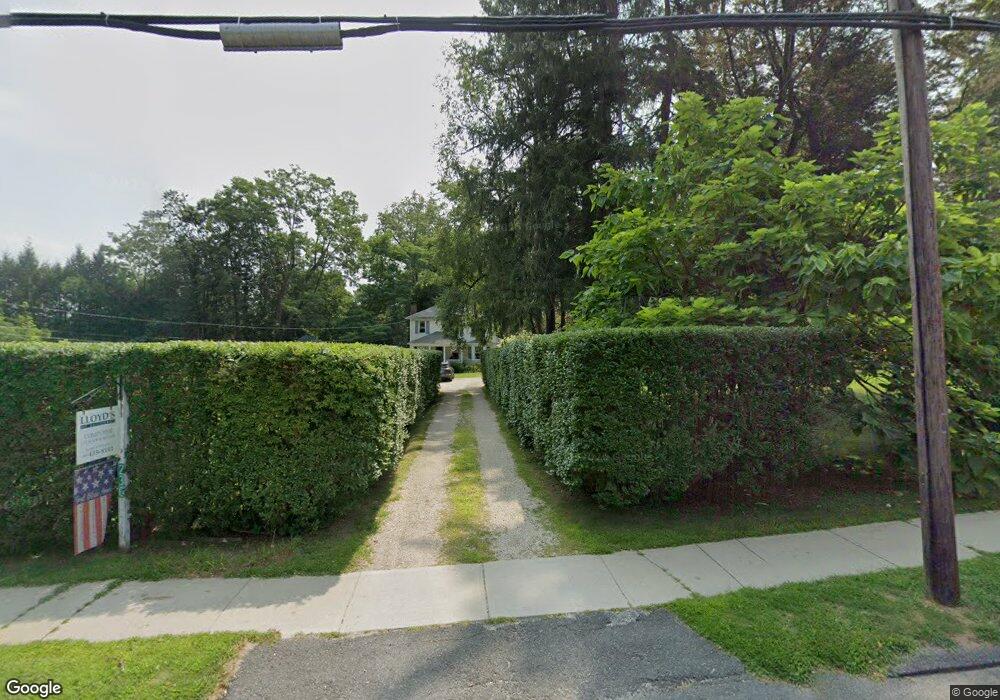
230 Main St Salisbury, CT 06068
Estimated Value: $359,000 - $743,000
4
Beds
2
Baths
1,708
Sq Ft
$298/Sq Ft
Est. Value
About This Home
This home is located at 230 Main St, Salisbury, CT 06068 and is currently estimated at $508,270, approximately $297 per square foot. 230 Main St is a home located in Litchfield County with nearby schools including Housatonic Valley Regional High School, Indian Mountain School, and The Hotchkiss School.
Ownership History
Date
Name
Owned For
Owner Type
Purchase Details
Closed on
Mar 28, 2002
Sold by
Tyler Lauren D and Tyler Larry D
Bought by
Wallingford John L
Current Estimated Value
Home Financials for this Owner
Home Financials are based on the most recent Mortgage that was taken out on this home.
Original Mortgage
$171,360
Interest Rate
6.88%
Mortgage Type
Purchase Money Mortgage
Create a Home Valuation Report for This Property
The Home Valuation Report is an in-depth analysis detailing your home's value as well as a comparison with similar homes in the area
Home Values in the Area
Average Home Value in this Area
Purchase History
| Date | Buyer | Sale Price | Title Company |
|---|---|---|---|
| Wallingford John L | $168,000 | -- | |
| Wallingford John L | $168,000 | -- |
Source: Public Records
Mortgage History
| Date | Status | Borrower | Loan Amount |
|---|---|---|---|
| Open | Wallingford John L | $164,820 | |
| Closed | Wallingford John L | $172,357 | |
| Closed | Wallingford John L | $171,360 |
Source: Public Records
Tax History Compared to Growth
Tax History
| Year | Tax Paid | Tax Assessment Tax Assessment Total Assessment is a certain percentage of the fair market value that is determined by local assessors to be the total taxable value of land and additions on the property. | Land | Improvement |
|---|---|---|---|---|
| 2025 | $1,786 | $162,400 | $113,300 | $49,100 |
| 2024 | $1,786 | $162,400 | $113,300 | $49,100 |
| 2023 | $1,786 | $162,400 | $113,300 | $49,100 |
| 2022 | $1,786 | $162,400 | $113,300 | $49,100 |
| 2021 | $1,786 | $162,400 | $113,300 | $49,100 |
| 2020 | $1,716 | $147,900 | $94,400 | $53,500 |
| 2019 | $1,716 | $147,900 | $94,400 | $53,500 |
| 2018 | $1,671 | $147,900 | $94,400 | $53,500 |
| 2017 | $1,642 | $147,900 | $94,400 | $53,500 |
| 2016 | $1,583 | $147,900 | $94,400 | $53,500 |
| 2015 | $1,514 | $141,500 | $83,100 | $58,400 |
| 2014 | $1,786 | $170,100 | $83,100 | $87,000 |
Source: Public Records
Map
Nearby Homes
- 267 Main St
- 21 Lakeview Ave
- 299 Main St
- 308 Main St
- 91 Main St
- 8 Holley St
- 21 Perry St
- 56 Sharon Rd
- 50 Millerton Rd
- 110 Sharon Rd
- 126 Sharon Rd
- 53 Upland Meadow Rd
- 0 Under Mountain Rd
- 38 Under Mountain Rd
- 50 Main St
- 47 E Main St
- 2 Ledgewood Rd
- 278 and 282 Farnum Rd
- 87 Canaan Rd Unit 2F
- 87 Canaan Rd Unit 6A