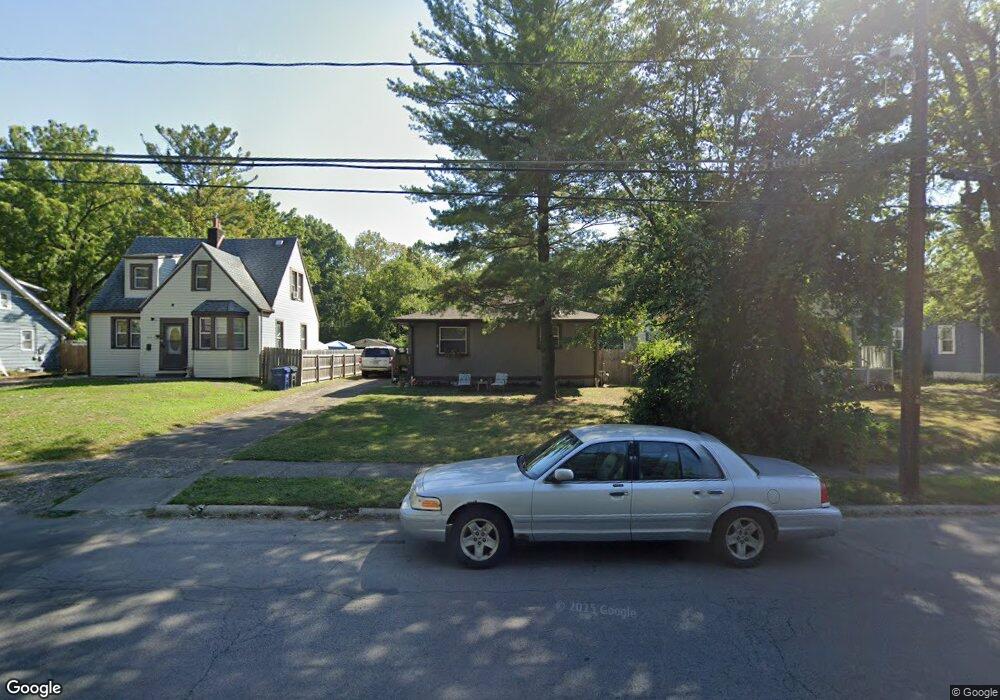
230 Maplewood Ave Columbus, OH 43213
Estimated Value: $191,426 - $239,000
4
Beds
3
Baths
1,232
Sq Ft
$175/Sq Ft
Est. Value
About This Home
This home is located at 230 Maplewood Ave, Columbus, OH 43213 and is currently estimated at $215,357, approximately $174 per square foot. 230 Maplewood Ave is a home located in Franklin County with nearby schools including Beechwood Elementary School, Etna Road Elementary School, and Rosemore Middle School.
Ownership History
Date
Name
Owned For
Owner Type
Purchase Details
Closed on
Feb 19, 2016
Sold by
Reynolds Eva M and Reynolds William J
Bought by
Reynolds Eva Marie
Current Estimated Value
Home Financials for this Owner
Home Financials are based on the most recent Mortgage that was taken out on this home.
Original Mortgage
$107,310
Outstanding Balance
$86,692
Interest Rate
4.37%
Mortgage Type
FHA
Estimated Equity
$128,665
Purchase Details
Closed on
May 31, 2006
Sold by
Phillips D Bruce and Phillips Carol J
Bought by
Reynolds Eva M
Home Financials for this Owner
Home Financials are based on the most recent Mortgage that was taken out on this home.
Original Mortgage
$110,000
Interest Rate
8.25%
Mortgage Type
Fannie Mae Freddie Mac
Purchase Details
Closed on
Aug 4, 1996
Sold by
Sparks Rodney D
Bought by
Phillips D Bruce and Phillips Carol J
Purchase Details
Closed on
Jan 17, 1991
Bought by
Phillips Phillips D and Phillips Carol
Purchase Details
Closed on
May 26, 1988
Purchase Details
Closed on
May 20, 1988
Create a Home Valuation Report for This Property
The Home Valuation Report is an in-depth analysis detailing your home's value as well as a comparison with similar homes in the area
Home Values in the Area
Average Home Value in this Area
Purchase History
| Date | Buyer | Sale Price | Title Company |
|---|---|---|---|
| Reynolds Eva Marie | -- | None Available | |
| Reynolds Eva M | $110,000 | Covenant Title Services Llc | |
| Phillips D Bruce | $43,200 | -- | |
| Phillips Phillips D | $35,000 | -- | |
| -- | $7,500 | -- | |
| -- | -- | -- |
Source: Public Records
Mortgage History
| Date | Status | Borrower | Loan Amount |
|---|---|---|---|
| Open | Reynolds Eva Marie | $107,310 | |
| Closed | Reynolds Eva M | $110,000 |
Source: Public Records
Tax History Compared to Growth
Tax History
| Year | Tax Paid | Tax Assessment Tax Assessment Total Assessment is a certain percentage of the fair market value that is determined by local assessors to be the total taxable value of land and additions on the property. | Land | Improvement |
|---|---|---|---|---|
| 2024 | $2,465 | $56,390 | $15,580 | $40,810 |
| 2023 | $2,447 | $56,385 | $15,575 | $40,810 |
| 2022 | $2,069 | $36,230 | $6,790 | $29,440 |
| 2021 | $1,943 | $36,230 | $6,790 | $29,440 |
| 2020 | $1,924 | $36,230 | $6,790 | $29,440 |
| 2019 | $1,772 | $29,020 | $5,430 | $23,590 |
| 2018 | $1,597 | $29,020 | $5,430 | $23,590 |
| 2017 | $1,544 | $29,020 | $5,430 | $23,590 |
| 2016 | $1,376 | $21,070 | $4,830 | $16,240 |
| 2015 | $1,388 | $21,070 | $4,830 | $16,240 |
| 2014 | $1,388 | $21,070 | $4,830 | $16,240 |
| 2013 | $734 | $23,415 | $5,355 | $18,060 |
Source: Public Records
Map
Nearby Homes
- 91 Maplewood Ave
- 320 Collingwood Ave
- 3814 Elbern Ave
- 178 S Weyant Ave
- 201 S Weyant Ave
- 91 Robinwood Ave
- 526 Collingwood Ave
- 88-90 N Waverly St
- 46 N Everett Ave
- 94 N Hampton Rd
- 73 N Everett Ave
- 247 S James Rd
- 277 S James Rd
- 647 S Napoleon Ave
- 646 S Weyant Ave
- 239 S Kellner Rd
- 4148 Elbern Ave
- 430 S James Rd
- 4154 Seigman Ave
- 3811 Brentwood Ct
- 234 Maplewood Ave
- 222 Maplewood Ave
- 240 Maplewood Ave
- 216 Maplewood Ave
- 248 Maplewood Ave
- 210 Maplewood Ave
- 223 Maplewood Ave
- 215 Maplewood Ave
- 204 Maplewood Ave
- 233 Maplewood Ave
- 256 Maplewood Ave
- 198 Maplewood Ave
- 251 Maplewood Ave
- 245 Maplewood Ave
- 3658 Elbern Ave
- 262 Maplewood Ave
- 3680 Elbern Ave
- 193 Maplewood Ave
- 259 Maplewood Ave
- 192 Maplewood Ave