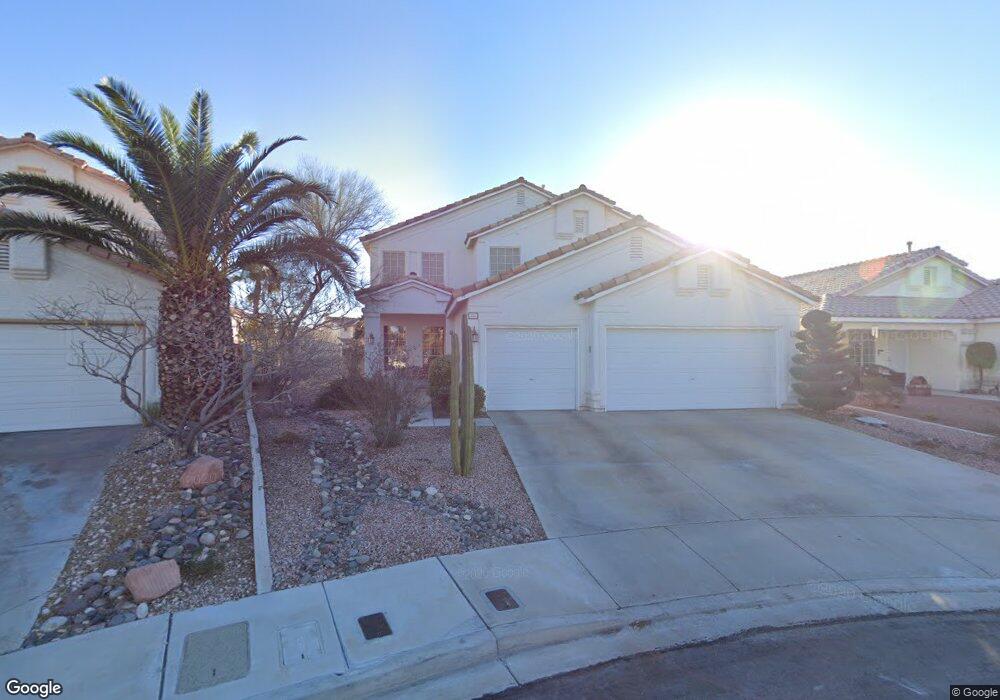
230 Mazatlan St Unit 2 Henderson, NV 89074
Green Valley North NeighborhoodEstimated Value: $499,639 - $567,000
4
Beds
4
Baths
2,391
Sq Ft
$225/Sq Ft
Est. Value
About This Home
This home is located at 230 Mazatlan St Unit 2, Henderson, NV 89074 and is currently estimated at $538,410, approximately $225 per square foot. 230 Mazatlan St Unit 2 is a home located in Clark County with nearby schools including James Gibson Elementary School, Barbara and Hank Greenspun Junior High School, and Green Valley High School.
Ownership History
Date
Name
Owned For
Owner Type
Purchase Details
Closed on
Mar 29, 2004
Sold by
Nlvk Llc
Bought by
Tull Jonathan D and Tull Danette J
Current Estimated Value
Home Financials for this Owner
Home Financials are based on the most recent Mortgage that was taken out on this home.
Original Mortgage
$280,000
Outstanding Balance
$130,937
Interest Rate
5.57%
Mortgage Type
Unknown
Estimated Equity
$407,473
Purchase Details
Closed on
Oct 6, 2003
Sold by
Vargin Louis and Vargin Elsie
Bought by
Nlvk Llc
Purchase Details
Closed on
Oct 17, 1997
Sold by
Vargin Louis and Vargin Elsie J
Bought by
Vargin Louis and Vargin Elsie J
Purchase Details
Closed on
Oct 13, 1995
Sold by
Coral Ridge
Bought by
Vargin Louis and Vargin Elsie
Home Financials for this Owner
Home Financials are based on the most recent Mortgage that was taken out on this home.
Original Mortgage
$120,600
Interest Rate
7.59%
Create a Home Valuation Report for This Property
The Home Valuation Report is an in-depth analysis detailing your home's value as well as a comparison with similar homes in the area
Home Values in the Area
Average Home Value in this Area
Purchase History
| Date | Buyer | Sale Price | Title Company |
|---|---|---|---|
| Tull Jonathan D | $350,000 | National Title Company | |
| Nlvk Llc | $205,000 | National Title Company | |
| Vargin Louis | -- | -- | |
| Vargin Louis | $161,000 | Old Republic Title Company |
Source: Public Records
Mortgage History
| Date | Status | Borrower | Loan Amount |
|---|---|---|---|
| Open | Tull Jonathan D | $280,000 | |
| Previous Owner | Vargin Louis | $120,600 | |
| Closed | Tull Jonathan D | $35,000 |
Source: Public Records
Tax History Compared to Growth
Tax History
| Year | Tax Paid | Tax Assessment Tax Assessment Total Assessment is a certain percentage of the fair market value that is determined by local assessors to be the total taxable value of land and additions on the property. | Land | Improvement |
|---|---|---|---|---|
| 2025 | $2,193 | $114,159 | $37,100 | $77,059 |
| 2024 | $2,130 | $114,159 | $37,100 | $77,059 |
| 2023 | $2,130 | $113,201 | $39,725 | $73,476 |
| 2022 | $1,738 | $97,825 | $30,450 | $67,375 |
| 2021 | $2,008 | $94,571 | $30,450 | $64,121 |
| 2020 | $1,946 | $94,042 | $30,450 | $63,592 |
| 2019 | $1,889 | $90,794 | $27,650 | $63,144 |
| 2018 | $1,834 | $79,453 | $18,900 | $60,553 |
| 2017 | $2,291 | $79,039 | $17,500 | $61,539 |
| 2016 | $1,738 | $77,684 | $15,750 | $61,934 |
| 2015 | $1,734 | $67,605 | $9,450 | $58,155 |
| 2014 | $1,683 | $56,372 | $9,450 | $46,922 |
Source: Public Records
Map
Nearby Homes
- 217 Turkey Creek Way
- 1805 Candle Bright Dr
- 1633 Cave Spring Dr
- 1725 Buttermilk Dr
- 1864 Woodhaven Dr
- 1851 Hillpointe Rd Unit 2524
- 1851 Hillpointe Rd Unit 2112
- 1851 Hillpointe Rd Unit 1811
- 1607 Box Step Dr
- 1795 Nuevo Rd
- 182 Codyerin Dr
- 203 Codyerin Dr
- 274 Helmsdale Dr
- 1839 Vaccaro Place
- 313 Vallarte Dr
- 151 Day St
- 325 Esquina Dr
- 327 Esquina Dr
- 1904 Coralino Dr
- 327 Fuente Dr
- 228 Mazatlan St
- 232 Mazatlan St
- 226 Mazatlan St
- 224 Mazatlan St
- 227 Mazatlan St
- 1741 Millstream Way
- 1750 Millstream Way Unit III
- 225 Mazatlan St
- 222 Mazatlan St
- 1739 Millstream Way
- 223 Mazatlan St Unit 2
- 1748 Millstream Way
- 223 Turkey Creek Way Unit III
- 220 Mazatlan St
- 221 Mazatlan St
- 221 Turkey Creek Way
- 221 Turkey Creek Way
- 1754 Saint Thomas Dr
- 1744 Millstream Way
- 219 Turkey Creek Way Unit III