230 Mcgoldrick Way Unit 1 Sparks, NV 89431
McCarran Boulevard-Probasco NeighborhoodEstimated Value: $399,001 - $434,000
3
Beds
2
Baths
1,203
Sq Ft
$352/Sq Ft
Est. Value
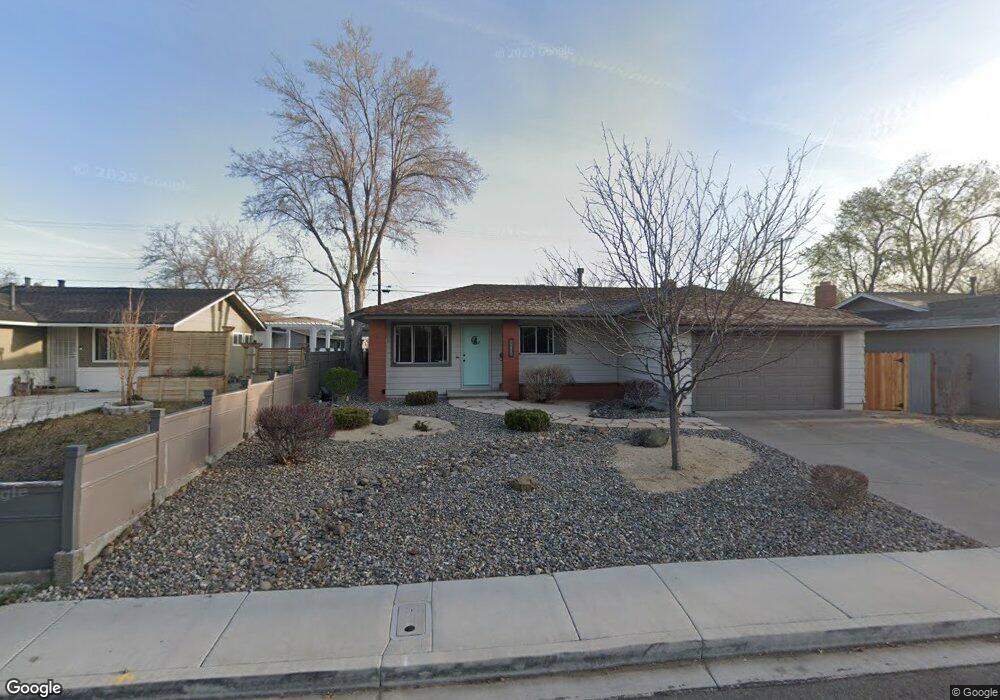
About This Home
This home is located at 230 Mcgoldrick Way Unit 1, Sparks, NV 89431 and is currently estimated at $424,000, approximately $352 per square foot. 230 Mcgoldrick Way Unit 1 is a home located in Washoe County with nearby schools including Florence Drake Elementary School, George L Dilworth Middle School, and Sparks High School.
Ownership History
Date
Name
Owned For
Owner Type
Purchase Details
Closed on
Jun 11, 2015
Sold by
Osterhoudt Laurie M
Bought by
Osterhoudt Laurie M and L M Osterhoudt Living Trust
Current Estimated Value
Purchase Details
Closed on
Oct 13, 2011
Sold by
Innamorati Giovanna and Marchini Massimo
Bought by
Osterhoudt Laurie M
Home Financials for this Owner
Home Financials are based on the most recent Mortgage that was taken out on this home.
Original Mortgage
$84,000
Outstanding Balance
$57,153
Interest Rate
4.05%
Mortgage Type
New Conventional
Estimated Equity
$366,847
Purchase Details
Closed on
Oct 19, 2004
Sold by
Marchini Massimo and Innamorati Giovanna
Bought by
Marchini Massimo and Innamorati Giovanna
Purchase Details
Closed on
Aug 19, 2004
Sold by
Collins Joseph and Wiesman Marie
Bought by
Marchini Massimo and Innamorati Giovanna
Create a Home Valuation Report for This Property
The Home Valuation Report is an in-depth analysis detailing your home's value as well as a comparison with similar homes in the area
Home Values in the Area
Average Home Value in this Area
Purchase History
| Date | Buyer | Sale Price | Title Company |
|---|---|---|---|
| Osterhoudt Laurie M | -- | None Available | |
| Osterhoudt Laurie M | $105,000 | First Centennial Reno | |
| Marchini Massimo | -- | -- | |
| Marchini Massimo | $190,000 | First Centennial Title Co |
Source: Public Records
Mortgage History
| Date | Status | Borrower | Loan Amount |
|---|---|---|---|
| Open | Osterhoudt Laurie M | $84,000 |
Source: Public Records
Tax History Compared to Growth
Tax History
| Year | Tax Paid | Tax Assessment Tax Assessment Total Assessment is a certain percentage of the fair market value that is determined by local assessors to be the total taxable value of land and additions on the property. | Land | Improvement |
|---|---|---|---|---|
| 2025 | $714 | $51,459 | $33,565 | $17,894 |
| 2024 | $694 | $47,716 | $30,065 | $17,651 |
| 2023 | $694 | $47,663 | $31,325 | $16,338 |
| 2022 | $502 | $39,488 | $26,180 | $13,308 |
| 2021 | $655 | $30,916 | $17,955 | $12,961 |
| 2020 | $634 | $29,656 | $16,940 | $12,716 |
| 2019 | $616 | $27,915 | $15,890 | $12,025 |
| 2018 | $598 | $23,277 | $11,725 | $11,552 |
| 2017 | $577 | $21,737 | $10,395 | $11,342 |
| 2016 | $566 | $20,701 | $9,345 | $11,356 |
| 2015 | -- | $18,971 | $7,700 | $11,271 |
| 2014 | $549 | $17,095 | $6,440 | $10,655 |
| 2013 | -- | $14,630 | $4,270 | $10,360 |
Source: Public Records
Map
Nearby Homes
- 119 Devere Way
- 10 Sheridan Way
- 465 Lenwood Dr
- 1940 4th St Unit 20
- 1940 4th St Unit 51
- 1945 4th St Unit 32
- 1945 4th St Unit 33
- 1945 4th St Unit 10
- 1703 1st St
- 120 E Lenwood Dr
- 780 Emerson Way
- 8 E O St
- 3245 Elaine Way
- 2865 Patrice Dr
- 3071 Meadowlands Dr
- 1705 9th St
- 3465 Dawn Cir
- 3104 Sandy St
- 1110 Xman Way
- 1003 Sbragia Way
- 210 Mcgoldrick Way
- 200 Mcgoldrick Way
- 231 Galleron Way
- 280 Mcgoldrick Way
- 251 Galleron Way
- 201 Galleron Way
- 211 Galleron Way
- 231 Mcgoldrick Way
- 182 Mcgoldrick Way
- 281 Galleron Way
- 211 Mcgoldrick Way
- 251 Mcgoldrick Way
- 300 Mcgoldrick Way
- 201 Mcgoldrick Way
- 183 Galleron Way
- 281 Mcgoldrick Way
- 301 Galleron Way
- 164 Mc Goldrick Way
- 164 Mcgoldrick Way
- 183 Mcgoldrick Way