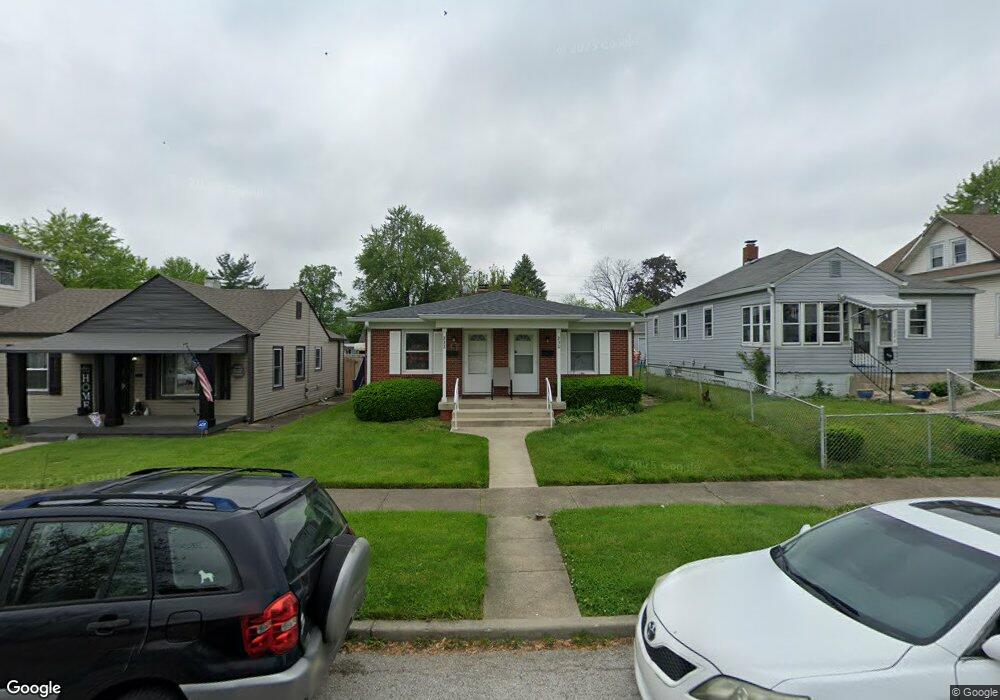
230 S 5th Ave Beech Grove, IN 46107
Estimated Value: $161,008 - $188,000
1
Bed
--
Bath
624
Sq Ft
$275/Sq Ft
Est. Value
About This Home
This home is located at 230 S 5th Ave, Beech Grove, IN 46107 and is currently estimated at $171,669, approximately $275 per square foot. 230 S 5th Ave is a home located in Marion County with nearby schools including Hornet Park Elementary School, Central Elementary School, and South Grove Intermediate School.
Ownership History
Date
Name
Owned For
Owner Type
Purchase Details
Closed on
Jun 1, 2017
Sold by
Smith Hugh
Bought by
Smith Hugh
Current Estimated Value
Purchase Details
Closed on
Dec 30, 2016
Sold by
Got Properties Llc
Bought by
Smith Hugh
Purchase Details
Closed on
Apr 6, 2009
Sold by
Breidenbaugh Kurt and Breidenbaugh Michelle
Bought by
G O T Properties Llc
Purchase Details
Closed on
Jan 19, 2009
Sold by
Higginbotham Philip K and Estate Of Rudolph L Higginboth
Bought by
Breidenbaugh Kurt W and Breidenbaugh Michelle R
Home Financials for this Owner
Home Financials are based on the most recent Mortgage that was taken out on this home.
Original Mortgage
$45,000
Interest Rate
5.03%
Mortgage Type
Purchase Money Mortgage
Create a Home Valuation Report for This Property
The Home Valuation Report is an in-depth analysis detailing your home's value as well as a comparison with similar homes in the area
Home Values in the Area
Average Home Value in this Area
Purchase History
| Date | Buyer | Sale Price | Title Company |
|---|---|---|---|
| Smith Hugh | -- | -- | |
| Barton Grace Properties Llc | -- | -- | |
| Smith Hugh | -- | -- | |
| Smith Hugh | -- | Security Title | |
| G O T Properties Llc | -- | None Available | |
| Breidenbaugh Kurt W | -- | Meridian |
Source: Public Records
Mortgage History
| Date | Status | Borrower | Loan Amount |
|---|---|---|---|
| Previous Owner | Breidenbaugh Kurt W | $45,000 |
Source: Public Records
Tax History Compared to Growth
Tax History
| Year | Tax Paid | Tax Assessment Tax Assessment Total Assessment is a certain percentage of the fair market value that is determined by local assessors to be the total taxable value of land and additions on the property. | Land | Improvement |
|---|---|---|---|---|
| 2024 | $3,413 | $137,200 | $17,000 | $120,200 |
| 2023 | $3,413 | $122,400 | $17,000 | $105,400 |
| 2022 | $3,393 | $113,200 | $17,000 | $96,200 |
| 2021 | $2,791 | $100,800 | $17,000 | $83,800 |
| 2020 | $2,369 | $91,000 | $17,000 | $74,000 |
| 2019 | $2,192 | $87,400 | $14,000 | $73,400 |
| 2018 | $1,849 | $76,400 | $14,000 | $62,400 |
| 2017 | $1,877 | $89,800 | $14,000 | $75,800 |
| 2016 | $2,140 | $86,400 | $14,000 | $72,400 |
| 2014 | $1,795 | $76,400 | $14,000 | $62,400 |
| 2013 | $1,551 | $66,000 | $14,000 | $52,000 |
Source: Public Records
Map
Nearby Homes