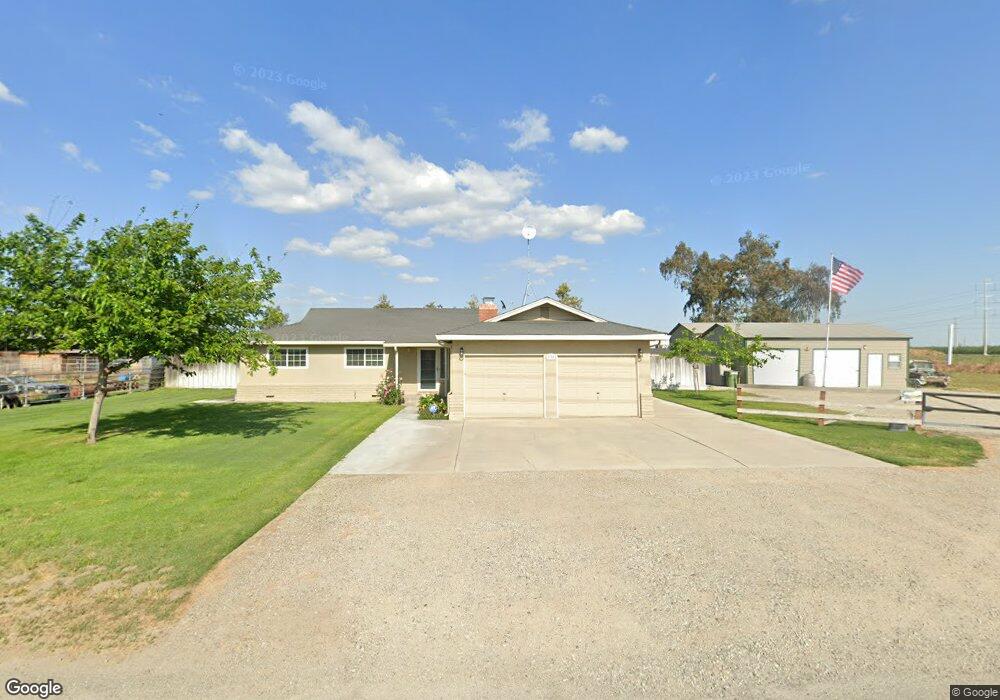
230 S Commons Rd Turlock, CA 95380
Estimated Value: $385,000 - $706,000
3
Beds
2
Baths
1,660
Sq Ft
$326/Sq Ft
Est. Value
About This Home
This home is located at 230 S Commons Rd, Turlock, CA 95380 and is currently estimated at $541,789, approximately $326 per square foot. 230 S Commons Rd is a home located in Stanislaus County with nearby schools including Chatom Elementary School, Mountain View Middle School, and Marvin A. Dutcher Middle School.
Ownership History
Date
Name
Owned For
Owner Type
Purchase Details
Closed on
Jan 31, 2019
Sold by
Silva Christopher and Silva Joy K
Bought by
Silva Christopher and Silva Joy K
Current Estimated Value
Purchase Details
Closed on
Jan 25, 2001
Sold by
Beneficial California Inc
Bought by
Silva Christopher G and Silva Joy K
Home Financials for this Owner
Home Financials are based on the most recent Mortgage that was taken out on this home.
Original Mortgage
$208,550
Outstanding Balance
$74,657
Interest Rate
7.13%
Estimated Equity
$467,132
Purchase Details
Closed on
Nov 3, 2000
Sold by
Eisenbeis David L and Eisenbeis Sharon D
Bought by
Beneficial California Inc
Create a Home Valuation Report for This Property
The Home Valuation Report is an in-depth analysis detailing your home's value as well as a comparison with similar homes in the area
Purchase History
| Date | Buyer | Sale Price | Title Company |
|---|---|---|---|
| Silva Christopher | -- | None Available | |
| Silva Christopher G | $215,000 | North American Title Co | |
| Beneficial California Inc | $145,001 | -- |
Source: Public Records
Mortgage History
| Date | Status | Borrower | Loan Amount |
|---|---|---|---|
| Open | Silva Christopher G | $208,550 |
Source: Public Records
Tax History
| Year | Tax Paid | Tax Assessment Tax Assessment Total Assessment is a certain percentage of the fair market value that is determined by local assessors to be the total taxable value of land and additions on the property. | Land | Improvement |
|---|---|---|---|---|
| 2025 | $3,715 | $350,469 | $188,345 | $162,124 |
| 2024 | $3,626 | $343,598 | $184,652 | $158,946 |
| 2023 | $3,630 | $336,862 | $181,032 | $155,830 |
| 2022 | $3,578 | $330,258 | $177,483 | $152,775 |
| 2021 | $3,521 | $323,783 | $174,003 | $149,780 |
| 2020 | $3,211 | $296,215 | $172,219 | $123,996 |
| 2019 | $3,161 | $290,408 | $168,843 | $121,565 |
| 2018 | $3,157 | $284,715 | $165,533 | $119,182 |
| 2017 | $3,054 | $279,134 | $162,288 | $116,846 |
| 2016 | $2,948 | $273,661 | $159,106 | $114,555 |
| 2015 | $2,427 | $223,500 | $129,500 | $94,000 |
| 2014 | $2,159 | $198,500 | $93,500 | $105,000 |
Source: Public Records
Map
Nearby Homes
- 1736 S Washington Rd
- 4207 W Linwood Ave
- 306 Fransil Ln
- 607 S Tegner Rd
- 4012 W Tuolumne Rd
- 3601 W Simmons Rd
- 1330 Dianne Dr
- 2625 W Main St
- 3718 W Tuolumne Rd
- 4013 W Tuolumne Rd
- 2631 Polous Dr
- 3131 W Main St
- 2175 W Main St
- 8631 Mitchell Rd
- 3000 W Tuolumne Rd
- 2450 Fulkerth Rd
- 2230 Aspenwood Dr
- 2400 Fulkerth Rd
- 500 N Tully Rd Unit 39
- 500 N Tully Rd
- 224 S Commons Rd
- 211 S Commons Rd
- 401 S Commons Rd
- 5512 W Main St
- 425 S Commons Rd
- 5412 W Main St
- 5718 W Main St
- 5701 W Main St
- 543 S Commons Rd
- 331 Holland Dr
- 5437 W Main St
- 207 Holland Dr
- 5924 W Main St
- 5919 W Main St
- 5118 W Main St
- 637 S Commons Rd
- 649 S Commons Rd
- 537 Holland Dr
- 624 S Commons Rd
- 5024 W Main St
Your Personal Tour Guide
Ask me questions while you tour the home.