Estimated Value: $538,000 - $803,648
About This Home
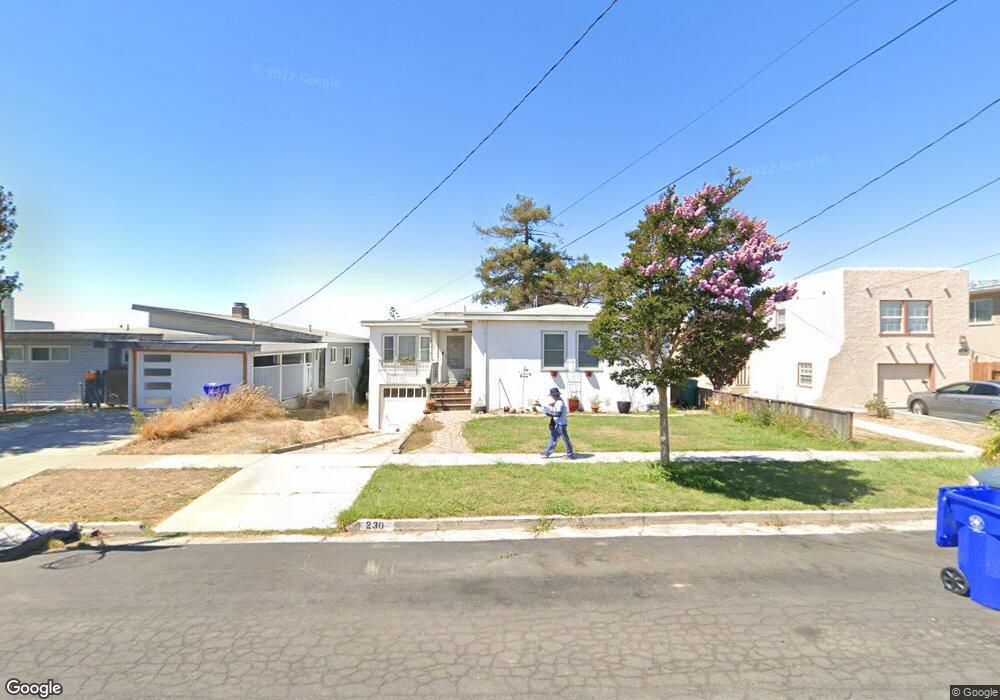
This home is located at 230 Sharon Ave, Rodeo, CA 94572 and is currently estimated at $695,912, approximately $423 per square foot. 230 Sharon Ave is a home located in Contra Costa County with nearby schools including Rodeo Hills Elementary School, Carquinez Middle School, and John Swett High School.
Ownership History
We collect this data history from publicly available records. To have your information removed, we recommend requesting removal directly through your county’s website.
Purchase Details
Home Financials for this Owner
Home Financials are based on the most recent Mortgage that was taken out on this home.Purchase Details
Home Values in the Area
Average Home Value in this Area
Purchase History
We collect this data history from publicly available records. To have your information removed, we recommend requesting removal directly through your county’s website.
| Date | Buyer | Sale Price | Title Company |
|---|---|---|---|
| $461,000 | North American Title Co | ||
| -- | -- |
Mortgage History
We collect this data history from publicly available records. To have your information removed, we recommend requesting removal directly through your county’s website.
| Date | Status | Borrower | Loan Amount |
|---|---|---|---|
| Open | $368,800 |
Tax History
We collect this data history from publicly available records. To have your information removed, we recommend requesting removal directly through your county’s website.
| Year | Tax Paid | Tax Assessment Tax Assessment Total Assessment is a certain percentage of the fair market value that is determined by local assessors to be the total taxable value of land and additions on the property. | Land | Improvement |
|---|---|---|---|---|
| 2025 | $9,785 | $709,556 | $446,588 | $262,968 |
| 2024 | $9,557 | $695,644 | $437,832 | $257,812 |
| 2023 | $9,557 | $682,005 | $429,248 | $252,757 |
| 2022 | $9,096 | $640,294 | $420,832 | $219,462 |
| 2021 | $7,531 | $510,000 | $320,000 | $190,000 |
| 2019 | $6,521 | $424,950 | $279,000 | $145,950 |
| 2018 | $5,798 | $370,000 | $225,000 | $145,000 |
| 2017 | $5,019 | $305,000 | $225,000 | $80,000 |
| 2016 | $4,392 | $278,500 | $205,402 | $73,098 |
| 2015 | $3,963 | $239,000 | $176,270 | $62,730 |
| 2014 | $3,370 | $187,000 | $137,918 | $49,082 |
Map
- 338 Garretson Ave
- 229 Lake Ave
- 139 Rodeo Ave
- 343 Rodeo Ave
- 205 Pacific Ave Unit 213
- 715 Mariposa Ave
- 11 Fallen Leaf Ct
- 1012 Salt Spray Terrace
- 103 Secret Cove
- 1334 7th St
- 836 Hawthorne Dr
- 1101 Chelsea
- 810 Dover
- 3198 S Front St
- 996 Sandpoint Dr
- 2036 Serra Ln
- 2081 Tsushima St
- 405 Weymouth
- 2144 Railroad Ave
- 216 Apollo Unit 7
Ask me questions while you tour the home.