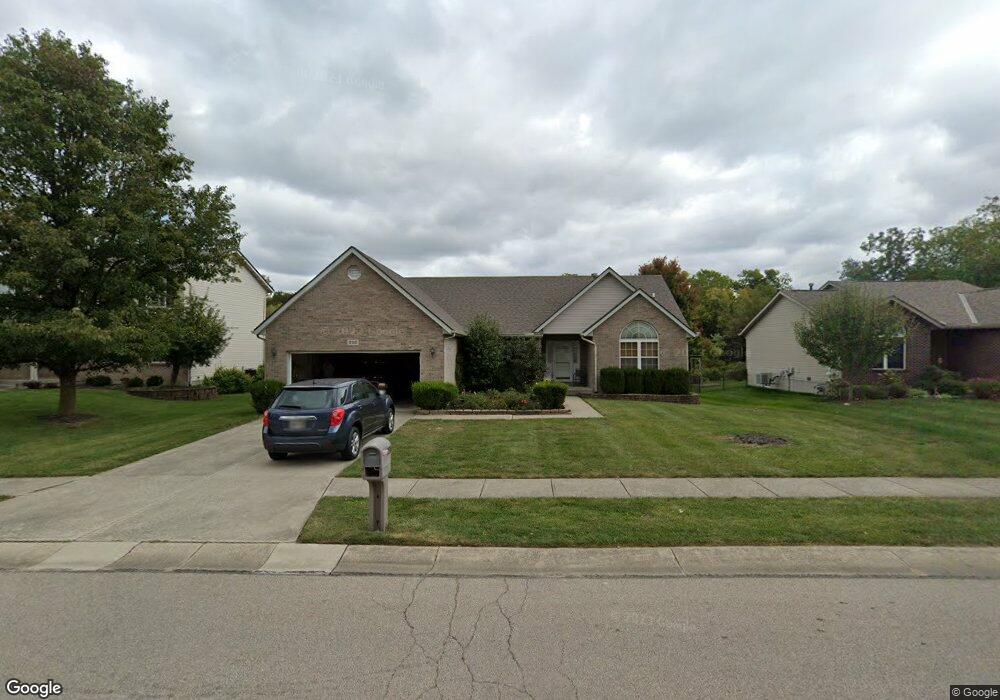
230 Stewart Way Monroe, OH 45050
Estimated Value: $358,475 - $396,000
3
Beds
2
Baths
1,887
Sq Ft
$199/Sq Ft
Est. Value
About This Home
This home is located at 230 Stewart Way, Monroe, OH 45050 and is currently estimated at $375,869, approximately $199 per square foot. 230 Stewart Way is a home located in Butler County with nearby schools including Monroe Primary School, Monroe Elementary School, and Monroe Junior High School.
Ownership History
Date
Name
Owned For
Owner Type
Purchase Details
Closed on
May 19, 2000
Sold by
Son Tech Inc
Bought by
Robinson Roy and Robinson Deborah
Current Estimated Value
Home Financials for this Owner
Home Financials are based on the most recent Mortgage that was taken out on this home.
Original Mortgage
$153,000
Outstanding Balance
$52,819
Interest Rate
8.13%
Mortgage Type
Purchase Money Mortgage
Estimated Equity
$323,050
Purchase Details
Closed on
Aug 4, 1999
Sold by
Monroe Meadows Development Company Ltd
Bought by
Son Tech Inc
Home Financials for this Owner
Home Financials are based on the most recent Mortgage that was taken out on this home.
Original Mortgage
$750,000
Outstanding Balance
$217,546
Interest Rate
7.77%
Mortgage Type
Credit Line Revolving
Estimated Equity
$158,323
Create a Home Valuation Report for This Property
The Home Valuation Report is an in-depth analysis detailing your home's value as well as a comparison with similar homes in the area
Home Values in the Area
Average Home Value in this Area
Purchase History
| Date | Buyer | Sale Price | Title Company |
|---|---|---|---|
| Robinson Roy | $170,040 | -- | |
| Son Tech Inc | $29,900 | -- |
Source: Public Records
Mortgage History
| Date | Status | Borrower | Loan Amount |
|---|---|---|---|
| Open | Robinson Roy | $153,000 | |
| Open | Son Tech Inc | $750,000 |
Source: Public Records
Tax History Compared to Growth
Tax History
| Year | Tax Paid | Tax Assessment Tax Assessment Total Assessment is a certain percentage of the fair market value that is determined by local assessors to be the total taxable value of land and additions on the property. | Land | Improvement |
|---|---|---|---|---|
| 2024 | $4,107 | $100,680 | $13,650 | $87,030 |
| 2023 | $4,095 | $102,900 | $13,650 | $89,250 |
| 2022 | $2,958 | $66,990 | $13,650 | $53,340 |
| 2021 | $2,850 | $66,990 | $13,650 | $53,340 |
| 2020 | $2,952 | $66,990 | $13,650 | $53,340 |
| 2019 | $4,239 | $61,830 | $14,810 | $47,020 |
| 2018 | $2,904 | $61,830 | $14,810 | $47,020 |
| 2017 | $2,965 | $61,830 | $14,810 | $47,020 |
| 2016 | $2,674 | $54,630 | $14,810 | $39,820 |
| 2015 | $2,644 | $54,630 | $14,810 | $39,820 |
| 2014 | $2,504 | $54,630 | $14,810 | $39,820 |
| 2013 | $2,504 | $52,520 | $10,860 | $41,660 |
Source: Public Records
Map
Nearby Homes
- 160 Gorman Ct
- 115 Meeker Ln
- 455 Stillpass Way
- 125 Dobbin Ct
- 881 Trails End Dr
- 145 Trotter Ln
- 95 Paddock Ln
- 157 Lena Dr
- 505 Austin Smith Dr
- 201 Moder Dr
- 225 Mason Ave
- 0 Wayne Madison Unit 1861405
- 7498 Cherokee Ln
- 75 Teil Tree Ct
- 32 W Elm St
- VANDERBURGH Plan at Caravel
- SEBASTIAN Plan at Caravel
- 6935 Gaspar Trail
- ASH LAWN Plan at Caravel
- BENNETT Plan at Caravel
- 220 Stewart Way
- 240 Stewart Way
- 210 Stewart Way
- 260 Stewart Way
- 235 Stewart Way
- 225 Stewart Way
- 245 Stewart Way
- 200 Stewart Way
- 660 Hiteshue Ave
- 280 Stewart Way
- 265 Stewart Way
- 670 Hiteshue Ave
- 198 Stewart Way
- 221 Steeplechase Ln
- 219 Steeplechase Ln
- 285 Stewart Way
- 680 Hiteshue Ave
- 217 Steeplechase Ln
- 220 Sackett Dr
- 223 Steeplechase Ln