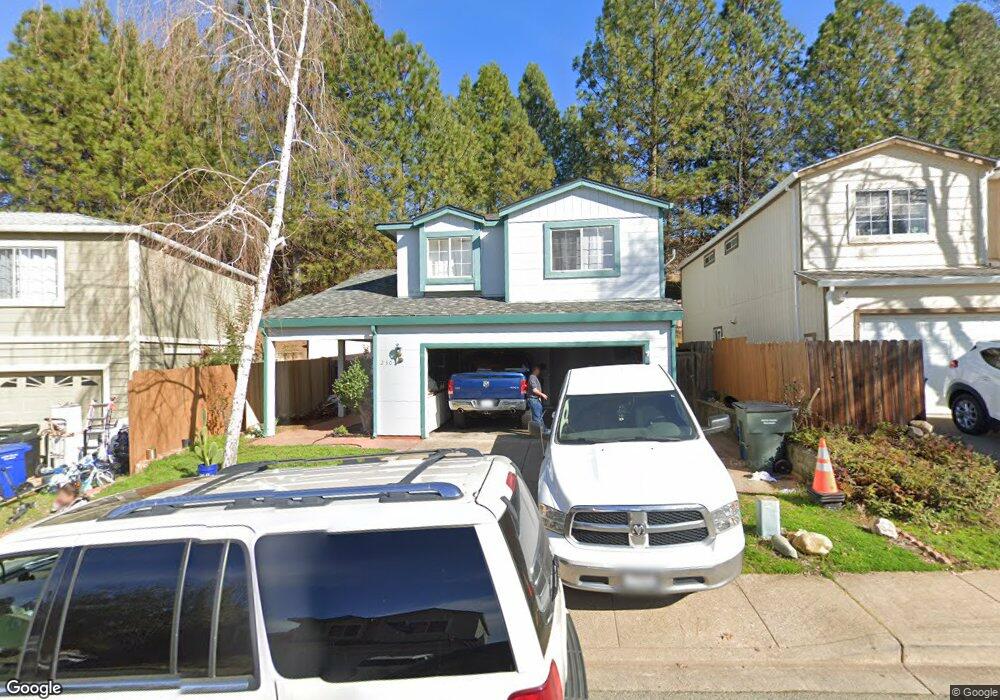
230 Terrace View Cir Jackson, CA 95642
Estimated Value: $368,741 - $403,000
3
Beds
3
Baths
1,631
Sq Ft
$237/Sq Ft
Est. Value
About This Home
This home is located at 230 Terrace View Cir, Jackson, CA 95642 and is currently estimated at $386,185, approximately $236 per square foot. 230 Terrace View Cir is a home located in Amador County with nearby schools including Jackson Elementary School, Jackson Junior High School, and Argonaut High School.
Ownership History
Date
Name
Owned For
Owner Type
Purchase Details
Closed on
Dec 17, 2010
Sold by
Griffin Barry M
Bought by
Griffin Barry M
Current Estimated Value
Home Financials for this Owner
Home Financials are based on the most recent Mortgage that was taken out on this home.
Original Mortgage
$127,000
Outstanding Balance
$84,460
Interest Rate
4.35%
Mortgage Type
New Conventional
Estimated Equity
$301,725
Purchase Details
Closed on
Jul 13, 2006
Sold by
Bohl Michael C and Bohl Rita S
Bought by
Bohl Michael C and Bohl Rita S
Purchase Details
Closed on
Mar 14, 2006
Sold by
Bohl Michael C and Bohl Rita S
Bought by
Bohl Michael C and Bohl Rita S
Purchase Details
Closed on
Jul 25, 2001
Sold by
Bohl Michael C and Bohl Pamela B
Bought by
Griffin Barry M
Home Financials for this Owner
Home Financials are based on the most recent Mortgage that was taken out on this home.
Original Mortgage
$81,700
Interest Rate
8.12%
Create a Home Valuation Report for This Property
The Home Valuation Report is an in-depth analysis detailing your home's value as well as a comparison with similar homes in the area
Home Values in the Area
Average Home Value in this Area
Purchase History
| Date | Buyer | Sale Price | Title Company |
|---|---|---|---|
| Griffin Barry M | -- | Wfg Title Ins Co | |
| Bohl Michael C | -- | None Available | |
| Bohl Michael C | -- | None Available | |
| Bohl Michael C | -- | None Available | |
| Bohl Michael C | -- | None Available | |
| Bohl Michael C | -- | None Available | |
| Griffin Barry M | $132,000 | First American Title Co |
Source: Public Records
Mortgage History
| Date | Status | Borrower | Loan Amount |
|---|---|---|---|
| Open | Griffin Barry M | $127,000 | |
| Closed | Griffin Barry M | $81,700 |
Source: Public Records
Tax History
| Year | Tax Paid | Tax Assessment Tax Assessment Total Assessment is a certain percentage of the fair market value that is determined by local assessors to be the total taxable value of land and additions on the property. | Land | Improvement |
|---|---|---|---|---|
| 2025 | $1,965 | $194,963 | $59,075 | $135,888 |
| 2024 | $1,965 | $191,141 | $57,917 | $133,224 |
| 2023 | $1,928 | $187,394 | $56,782 | $130,612 |
| 2022 | $1,892 | $183,720 | $55,669 | $128,051 |
| 2021 | $1,857 | $180,119 | $54,578 | $125,541 |
| 2020 | $1,839 | $178,273 | $54,019 | $124,254 |
| 2019 | $1,803 | $174,778 | $52,960 | $121,818 |
| 2018 | $1,769 | $171,352 | $51,922 | $119,430 |
| 2017 | $1,736 | $167,993 | $50,904 | $117,089 |
| 2016 | $1,703 | $164,700 | $49,906 | $114,794 |
| 2015 | $1,679 | $162,227 | $49,157 | $113,070 |
| 2014 | $1,646 | $159,051 | $48,195 | $110,856 |
Source: Public Records
Map
Nearby Homes
- 143 Emerald Ln
- 101 Terrace View Cir
- 2043 Thomas Dr
- 1811 Goldstone Ave
- 225 Scottsville Dr
- 1571 Nevill Ct
- 581 Scottsville Blvd
- 150 Clinton Rd Unit 23
- 150 Clinton Rd Unit 17
- 150 Clinton Rd Unit 38
- 150 Clinton Rd
- 515 Clinton Rd
- 705 Kristi Ct
- 513 Perry St
- 420 South Ave
- 436 Bright Ave
- 7680 Middle Bar Rd
- 126 Center St
- 0 Golden Chain Hwy
- 604 Mill Place
- 220 Terrace View Cir
- 240 Terrace View Cir
- 210 Terrace View Cir
- 142 Emerald Ln
- 200 Terrace View Cir
- 195 Terrace View Cir
- 250 Terrace View Cir
- 205 Terrace View Cir
- 185 Terrace View Cir
- 150 Emerald Ln
- 260 Terrace View Cir
- 175 Terrace View Cir
- 190 Terrace View Cir
- 270 Terrace View Cir
- 165 Terrace View Cir
- 126 Emerald Ln
- 158 Emerald Ln
- 180 Terrace View Cir
- 280 Terrace View Cir
- 183 Emerald Ln
Your Personal Tour Guide
Ask me questions while you tour the home.