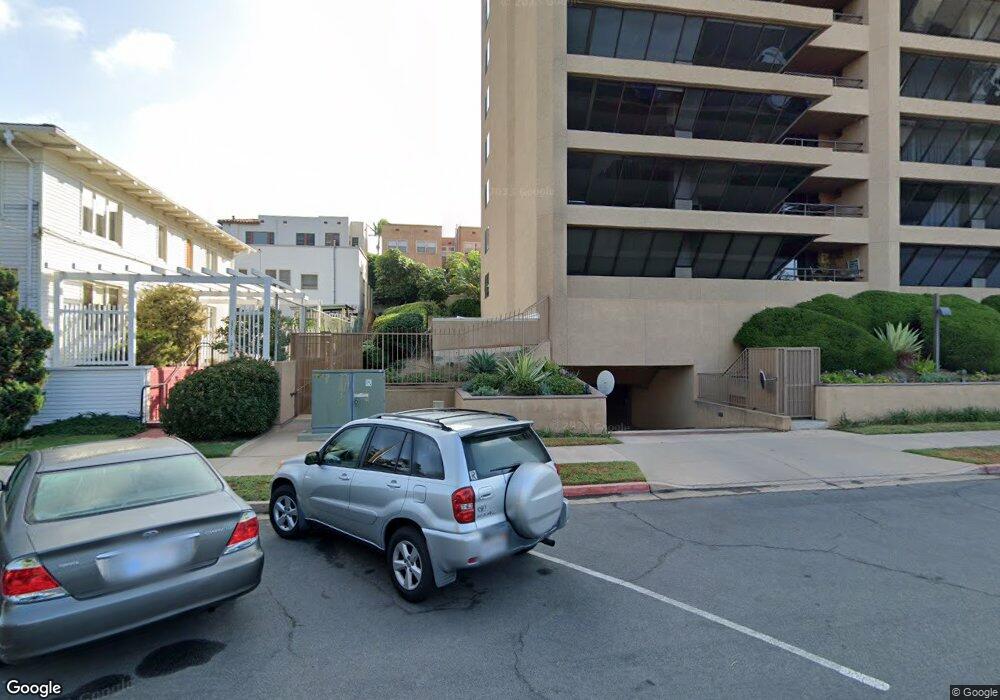
Brittany Towers 230 W Laurel St Unit 705 San Diego, CA 92101
Bankers Hill NeighborhoodEstimated Value: $1,012,000 - $1,071,000
3
Beds
2
Baths
1,866
Sq Ft
$563/Sq Ft
Est. Value
About This Home
This home is located at 230 W Laurel St Unit 705, San Diego, CA 92101 and is currently estimated at $1,050,084, approximately $562 per square foot. 230 W Laurel St Unit 705 is a home located in San Diego County with nearby schools including Florence Elementary School, Roosevelt International Middle School, and Museum School.
Ownership History
Date
Name
Owned For
Owner Type
Purchase Details
Closed on
Apr 21, 1999
Sold by
Curren Anna M
Bought by
Curren Anna M
Current Estimated Value
Purchase Details
Closed on
Aug 8, 1997
Sold by
Grihalva Richard A and Grihalva Virginia M
Bought by
Curren Anna M
Home Financials for this Owner
Home Financials are based on the most recent Mortgage that was taken out on this home.
Original Mortgage
$303,750
Outstanding Balance
$45,849
Interest Rate
7.62%
Estimated Equity
$1,004,235
Purchase Details
Closed on
Jun 11, 1997
Sold by
Grihalva Thomas Bonnie
Bought by
Grihalva Richard A and Grihalva Virginia M
Home Financials for this Owner
Home Financials are based on the most recent Mortgage that was taken out on this home.
Original Mortgage
$303,750
Outstanding Balance
$45,849
Interest Rate
7.62%
Estimated Equity
$1,004,235
Purchase Details
Closed on
Jul 3, 1996
Sold by
Thomas Jesse J
Bought by
Thomas Bonnie Grihalva
Purchase Details
Closed on
Feb 24, 1994
Sold by
Hynes Paul J and Hynes Joan L
Bought by
Grihalva Richard A and Grihalva Virginia M
Purchase Details
Closed on
Aug 18, 1988
Create a Home Valuation Report for This Property
The Home Valuation Report is an in-depth analysis detailing your home's value as well as a comparison with similar homes in the area
Home Values in the Area
Average Home Value in this Area
Purchase History
| Date | Buyer | Sale Price | Title Company |
|---|---|---|---|
| Curren Anna M | -- | -- | |
| Curren Anna M | $405,000 | Fidelity National Title | |
| Grihalva Richard A | -- | -- | |
| Thomas Bonnie Grihalva | -- | -- | |
| Thomas Bonnie Grihalva | -- | -- | |
| Grihalva Richard A | $320,000 | -- | |
| -- | $330,000 | -- |
Source: Public Records
Mortgage History
| Date | Status | Borrower | Loan Amount |
|---|---|---|---|
| Open | Curren Anna M | $303,750 |
Source: Public Records
Tax History Compared to Growth
Tax History
| Year | Tax Paid | Tax Assessment Tax Assessment Total Assessment is a certain percentage of the fair market value that is determined by local assessors to be the total taxable value of land and additions on the property. | Land | Improvement |
|---|---|---|---|---|
| 2025 | $7,732 | $646,665 | $319,342 | $327,323 |
| 2024 | $7,732 | $633,986 | $313,081 | $320,905 |
| 2023 | $7,560 | $621,556 | $306,943 | $314,613 |
| 2022 | $7,357 | $609,370 | $300,925 | $308,445 |
| 2021 | $7,305 | $597,423 | $295,025 | $302,398 |
| 2020 | $7,216 | $591,298 | $292,000 | $299,298 |
| 2019 | $7,086 | $579,705 | $286,275 | $293,430 |
| 2018 | $6,624 | $568,339 | $280,662 | $287,677 |
| 2017 | $6,465 | $557,196 | $275,159 | $282,037 |
| 2016 | $6,361 | $546,271 | $269,764 | $276,507 |
| 2015 | $6,266 | $538,066 | $265,712 | $272,354 |
| 2014 | $6,166 | $527,527 | $260,508 | $267,019 |
Source: Public Records
About Brittany Towers
Map
Nearby Homes
- 230 W Laurel St Unit 601
- 230 W Laurel St Unit 506
- 2445 Brant St Unit 612
- 2445 Brant St Unit 613
- 2445 Brant St Unit 309
- 2414 Front St Unit 31
- 2414 Front St Unit 11C
- 2630 Front St
- 2410 Albatross St Unit 9
- 450 W Laurel St
- 2621 1st Ave
- 2453 Curlew St
- 2371 Brant St
- 2620 2nd Ave Unit 5A
- 2620 2nd Ave Unit 5B
- 405 W Nutmeg St
- 2330 1st Ave Unit 115
- 2730 Brant St
- 2266 Albatross St Unit B
- 2206 Albatross St
- 230 W Laurel St
- 230 W Laurel St Unit 306
- 230 W Laurel St Unit 702
- 230 W Laurel St Unit 703
- 230 W Laurel St Unit 704
- 230 W Laurel St Unit 706
- 230 W Laurel St Unit 603
- 230 W Laurel St Unit 604
- 230 W Laurel St Unit 605
- 230 W Laurel St Unit 606
- 230 W Laurel St Unit 501
- 230 W Laurel St Unit 502
- 230 W Laurel St Unit 504
- 230 W Laurel St Unit 505
- 230 W Laurel St Unit 401
- 230 W Laurel St Unit 402
- 230 W Laurel St Unit 403
- 230 W Laurel St Unit 405
- 230 W Laurel St Unit 406
- 230 W Laurel St Unit 302