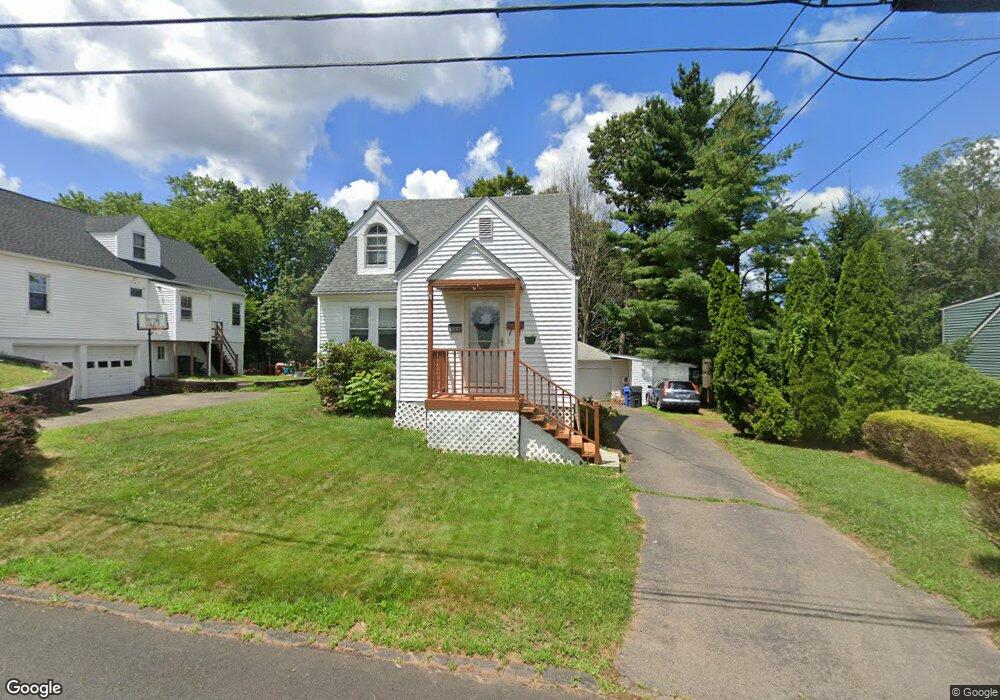
230 Williams St Meriden, CT 06450
Estimated Value: $219,000 - $296,000
2
Beds
1
Bath
1,210
Sq Ft
$213/Sq Ft
Est. Value
About This Home
This home is located at 230 Williams St, Meriden, CT 06450 and is currently estimated at $257,760, approximately $213 per square foot. 230 Williams St is a home located in New Haven County with nearby schools including Roger Sherman Elementary School, Washington Middle School, and Francis T. Maloney High School.
Ownership History
Date
Name
Owned For
Owner Type
Purchase Details
Closed on
Jan 31, 2025
Sold by
Bryers Adam
Bought by
969 Elm Llc
Current Estimated Value
Home Financials for this Owner
Home Financials are based on the most recent Mortgage that was taken out on this home.
Original Mortgage
$224,875
Outstanding Balance
$222,321
Interest Rate
6.85%
Mortgage Type
Commercial
Estimated Equity
$35,439
Purchase Details
Closed on
Dec 23, 2020
Sold by
Bryers Properties Llc
Bought by
Bryers Adam
Home Financials for this Owner
Home Financials are based on the most recent Mortgage that was taken out on this home.
Original Mortgage
$135,000
Interest Rate
2.7%
Mortgage Type
Balloon
Purchase Details
Closed on
Nov 10, 2014
Sold by
Sweeney Deneen A
Bought by
Sweeney Ralph W
Purchase Details
Closed on
Jun 28, 2001
Sold by
Macneil John F
Bought by
Sweeney Ralph W and Sweeney Deneen A
Create a Home Valuation Report for This Property
The Home Valuation Report is an in-depth analysis detailing your home's value as well as a comparison with similar homes in the area
Home Values in the Area
Average Home Value in this Area
Purchase History
| Date | Buyer | Sale Price | Title Company |
|---|---|---|---|
| 969 Elm Llc | $215,000 | None Available | |
| 969 Elm Llc | $215,000 | None Available | |
| Bryers Adam | -- | None Available | |
| Bryers Adam | -- | None Available | |
| Sweeney Ralph W | -- | -- | |
| Sweeney Ralph W | -- | -- | |
| Sweeney Ralph W | $93,350 | -- | |
| Sweeney Ralph W | $93,350 | -- |
Source: Public Records
Mortgage History
| Date | Status | Borrower | Loan Amount |
|---|---|---|---|
| Open | 969 Elm Llc | $224,875 | |
| Closed | 969 Elm Llc | $224,875 | |
| Previous Owner | Bryers Adam | $135,000 | |
| Previous Owner | Sweeney Ralph W | $30,000 | |
| Previous Owner | Sweeney Ralph W | $113,700 |
Source: Public Records
Tax History
| Year | Tax Paid | Tax Assessment Tax Assessment Total Assessment is a certain percentage of the fair market value that is determined by local assessors to be the total taxable value of land and additions on the property. | Land | Improvement |
|---|---|---|---|---|
| 2025 | $5,229 | $130,410 | $53,760 | $76,650 |
| 2024 | $4,735 | $130,410 | $53,760 | $76,650 |
| 2023 | $4,537 | $130,410 | $53,760 | $76,650 |
| 2022 | $4,302 | $130,410 | $53,760 | $76,650 |
| 2021 | $4,036 | $98,770 | $40,740 | $58,030 |
| 2020 | $4,036 | $98,770 | $40,740 | $58,030 |
| 2019 | $4,036 | $98,770 | $40,740 | $58,030 |
| 2018 | $4,054 | $98,770 | $40,740 | $58,030 |
| 2017 | $3,943 | $98,770 | $40,740 | $58,030 |
| 2016 | $3,813 | $104,090 | $42,700 | $61,390 |
| 2015 | $3,813 | $104,090 | $42,700 | $61,390 |
| 2014 | $3,720 | $104,090 | $42,700 | $61,390 |
Source: Public Records
Map
Nearby Homes
- 302 Gravel St
- 358 Gravel St
- 44 Woodlawn Terrace
- 515 Liberty St Unit 515
- 111 Sunset Ave Unit 111, 113, 115
- 111,113 & 115 Sunset Ave
- 499 Liberty St
- 153 Sterling Village Unit 153
- 43 N Pearl St
- 89 Baldwin Ave
- 131 Converse Ave
- 180 Bee St
- 170 Bee St
- 733 Broad St
- 160 Bee St
- 29 Schwink Dr
- 45 Meadow Way
- 130 Round Hill Rd
- 246 Metacomet Dr
- 53 Metacomet Dr
Your Personal Tour Guide
Ask me questions while you tour the home.