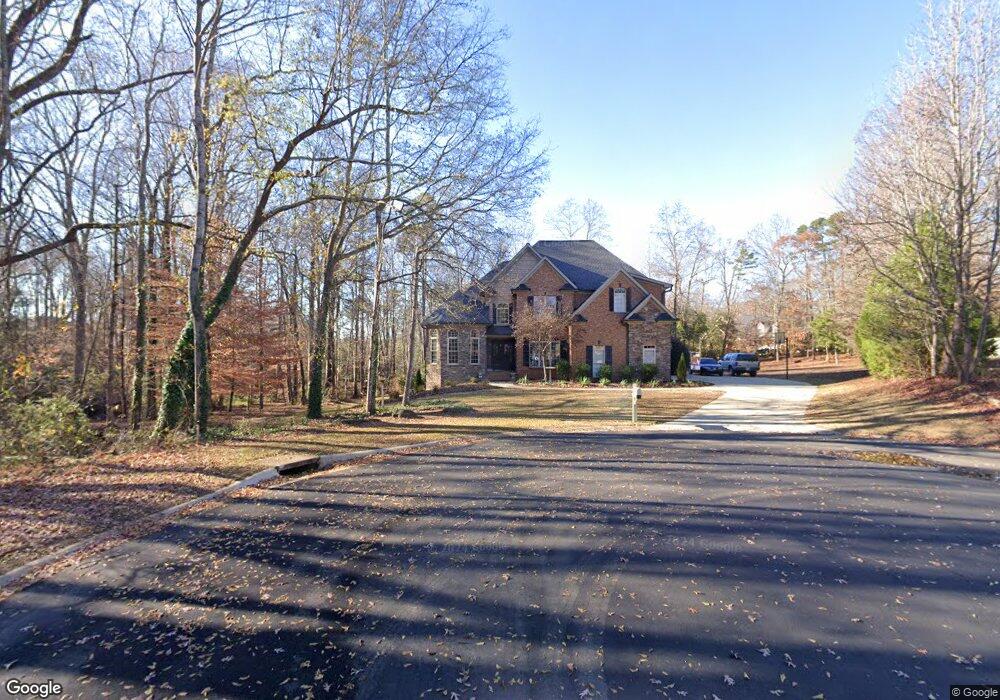
230 Willow Leaf Ct Spartanburg, SC 29301
Estimated Value: $544,000 - $708,000
4
Beds
3
Baths
3,413
Sq Ft
$189/Sq Ft
Est. Value
About This Home
This home is located at 230 Willow Leaf Ct, Spartanburg, SC 29301 and is currently estimated at $645,360, approximately $189 per square foot. 230 Willow Leaf Ct is a home located in Spartanburg County with nearby schools including Dorman High School Freshman Campus, Dorman High School, and Fine Arts Preparatory School.
Ownership History
Date
Name
Owned For
Owner Type
Purchase Details
Closed on
Jul 9, 2020
Sold by
Hubert Linda Bond and Spencer Linda Bond
Bought by
Hargrove Janet L and Hargrove Robert G
Current Estimated Value
Purchase Details
Closed on
Dec 23, 2008
Sold by
Spencer B Lynn
Bought by
Spencer Linda B
Home Financials for this Owner
Home Financials are based on the most recent Mortgage that was taken out on this home.
Original Mortgage
$409,500
Interest Rate
6.11%
Mortgage Type
Purchase Money Mortgage
Purchase Details
Closed on
Nov 14, 2008
Sold by
Custom Homes By Jerry I Miller Inc
Bought by
Spencer B Lynn
Home Financials for this Owner
Home Financials are based on the most recent Mortgage that was taken out on this home.
Original Mortgage
$409,500
Interest Rate
6.11%
Mortgage Type
Purchase Money Mortgage
Create a Home Valuation Report for This Property
The Home Valuation Report is an in-depth analysis detailing your home's value as well as a comparison with similar homes in the area
Home Values in the Area
Average Home Value in this Area
Purchase History
| Date | Buyer | Sale Price | Title Company |
|---|---|---|---|
| Hargrove Janet L | $485,000 | None Available | |
| Spencer Linda B | -- | -- | |
| Spencer B Lynn | $455,000 | -- |
Source: Public Records
Mortgage History
| Date | Status | Borrower | Loan Amount |
|---|---|---|---|
| Previous Owner | Spencer B Lynn | $409,500 |
Source: Public Records
Tax History Compared to Growth
Tax History
| Year | Tax Paid | Tax Assessment Tax Assessment Total Assessment is a certain percentage of the fair market value that is determined by local assessors to be the total taxable value of land and additions on the property. | Land | Improvement |
|---|---|---|---|---|
| 2025 | $3,330 | $22,310 | $1,886 | $20,424 |
| 2024 | $3,330 | $22,310 | $1,886 | $20,424 |
| 2023 | $3,330 | $22,310 | $1,886 | $20,424 |
| 2022 | $3,043 | $19,400 | $1,680 | $17,720 |
| 2021 | $3,043 | $19,400 | $1,680 | $17,720 |
| 2020 | $2,836 | $16,572 | $1,680 | $14,892 |
| 2019 | $2,811 | $16,572 | $1,680 | $14,892 |
| 2018 | $2,786 | $16,572 | $1,680 | $14,892 |
| 2017 | $2,588 | $15,680 | $1,680 | $14,000 |
| 2016 | $2,533 | $15,680 | $1,680 | $14,000 |
| 2015 | $2,561 | $15,680 | $1,680 | $14,000 |
| 2014 | $2,484 | $15,680 | $1,680 | $14,000 |
Source: Public Records
Map
Nearby Homes
- 168 Lake Park Dr
- 155 Lake Park Dr
- 381 Carleton Cir
- 405 Shafer Ct
- 192 Woodridge Dr
- 890 Acorn Ridge Place
- 307 Crandall Way
- 528 Windemere Ln
- 316 Bohler Ln
- 101 Harvest Brook Way
- 133 Harvest Brook Way
- 853 Oakcrest Rd
- 7 Holly Hill Dr
- 473 S Oakley Ln
- 1429 S Cardiff Trail
- 112 Ravines Ln
- 311 Kennesaw Ct
- 318 Ashwick Ct
- 161 Ravines Ln
- 226 Willow Leaf Ct
- 222 Willow Leaf Ct
- 426 Willowbrook Dr
- 172 Lake Park Dr
- 171 Lake Park Dr
- 441 Carleton Cir
- 435 Carleton Cir
- 218 Willow Leaf Ct
- 429 Carleton Cir
- 447 Carleton Cir
- 418 Willowbrook Dr
- 430 Willowbrook Dr
- 427 Willowbrook Dr
- 423 Carleton Cir
- 453 Carleton Cir
- 423 Willowbrook Dr
- 431 Willowbrook Dr
- 165 Lake Park Dr
- 214 Willow Leaf Ct
- 164 Lake Park Dr