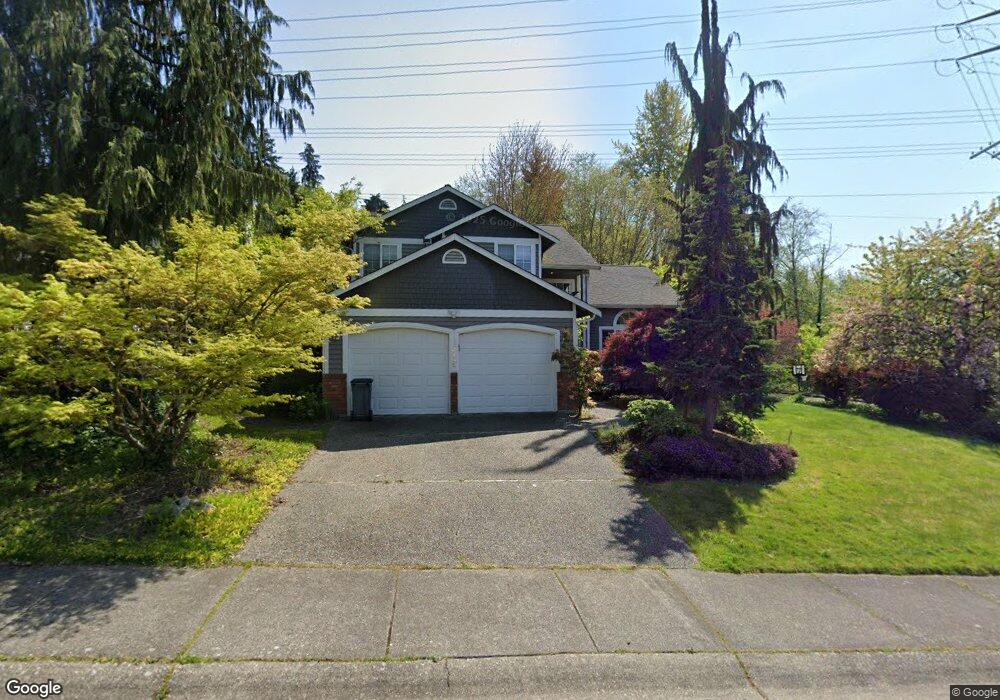
2300 211th St SE Bothell, WA 98021
Canyon Park NeighborhoodEstimated Value: $965,000 - $1,066,000
4
Beds
3
Baths
1,756
Sq Ft
$578/Sq Ft
Est. Value
About This Home
This home is located at 2300 211th St SE, Bothell, WA 98021 and is currently estimated at $1,015,004, approximately $578 per square foot. 2300 211th St SE is a home located in Snohomish County with nearby schools including Canyon Creek Elementary School, Skyview Middle School, and North Creek High School.
Ownership History
Date
Name
Owned For
Owner Type
Purchase Details
Closed on
Mar 10, 2016
Sold by
Lamb Andrew A and Lamb Elizabeth L
Bought by
Margerum Scott and Chen Jing
Current Estimated Value
Home Financials for this Owner
Home Financials are based on the most recent Mortgage that was taken out on this home.
Original Mortgage
$348,000
Outstanding Balance
$273,719
Interest Rate
3.79%
Mortgage Type
New Conventional
Estimated Equity
$741,285
Purchase Details
Closed on
Jan 7, 2009
Sold by
Lamb Andrew A
Bought by
Lamb Andrew A and Lamb Elizabeth L
Purchase Details
Closed on
Mar 25, 2002
Sold by
Joyner Aaron T and Joyner Danyel R
Bought by
Lamb Andrew A
Home Financials for this Owner
Home Financials are based on the most recent Mortgage that was taken out on this home.
Original Mortgage
$236,250
Interest Rate
6.84%
Purchase Details
Closed on
Aug 12, 1998
Sold by
Raport Ronald E and Raport Carol J
Bought by
Joyner Aaron T and Joyner Danyel R
Home Financials for this Owner
Home Financials are based on the most recent Mortgage that was taken out on this home.
Original Mortgage
$191,900
Interest Rate
6.91%
Create a Home Valuation Report for This Property
The Home Valuation Report is an in-depth analysis detailing your home's value as well as a comparison with similar homes in the area
Home Values in the Area
Average Home Value in this Area
Purchase History
| Date | Buyer | Sale Price | Title Company |
|---|---|---|---|
| Margerum Scott | $462,000 | First American Title Ins Co | |
| Lamb Andrew A | $93,258 | None Available | |
| Lamb Andrew A | $262,500 | First American Title Ins Co | |
| Joyner Aaron T | $202,000 | Fidelity National Title |
Source: Public Records
Mortgage History
| Date | Status | Borrower | Loan Amount |
|---|---|---|---|
| Open | Margerum Scott | $348,000 | |
| Previous Owner | Lamb Andrew A | $236,250 | |
| Previous Owner | Joyner Aaron T | $191,900 |
Source: Public Records
Tax History
| Year | Tax Paid | Tax Assessment Tax Assessment Total Assessment is a certain percentage of the fair market value that is determined by local assessors to be the total taxable value of land and additions on the property. | Land | Improvement |
|---|---|---|---|---|
| 2025 | $7,197 | $950,500 | $693,600 | $256,900 |
| 2024 | $7,197 | $856,200 | $608,200 | $248,000 |
| 2023 | $7,607 | $990,200 | $703,300 | $286,900 |
| 2022 | $6,399 | $670,300 | $426,800 | $243,500 |
| 2020 | $5,993 | $582,600 | $341,100 | $241,500 |
| 2019 | $5,257 | $529,000 | $289,800 | $239,200 |
| 2018 | $4,809 | $465,900 | $242,300 | $223,600 |
| 2017 | $3,967 | $387,500 | $196,700 | $190,800 |
| 2016 | $3,249 | $326,000 | $166,300 | $159,700 |
| 2015 | $3,353 | $319,900 | $170,100 | $149,800 |
| 2013 | $2,881 | $241,000 | $137,800 | $103,200 |
Source: Public Records
Map
Nearby Homes
- 1729 214th St SE
- 21708 24th Ave SE Unit A
- 20911 30th Dr SE
- 1615 208th St SE Unit 42
- 20500 32nd Dr SE
- 20318 Bothell Everett Hwy Unit A303
- 2115 201st Place SE Unit F4
- 2115 201st Place SE Unit K2
- 2115 201st Place SE Unit L2
- 1820 201st Place SE
- 2200 196th St SE Unit 25
- 2200 196th St SE Unit 66
- 2200 196th St SE Unit 76
- 2200 196th St SE Unit 30
- 2200 196th St SE Unit 70
- 22213 32nd Ave SE
- 3422 201st Place SE
- 20511 Greening Rd
- 20224 11th Dr SE
- 3618 202nd St SE
- 2306 211th St SE
- 2312 211th St SE
- 2301 211th St SE
- 21108 23rd Ave SE
- 2305 211th St SE
- 2314 211th St SE
- 2309 211th St SE
- 21102 23rd Ave SE
- 2313 211th St SE
- 2402 211th St SE
- 2315 211th St SE
- 2403 211th St SE
- 2411 211th St SE
- 2412 211th St SE
- 21011 23rd Ave SE
- 2405 211th St SE
- 2417 211th St SE
- 2409 211th St SE
- 2414 211th St SE
- 21030 25th Dr SE
Your Personal Tour Guide
Ask me questions while you tour the home.