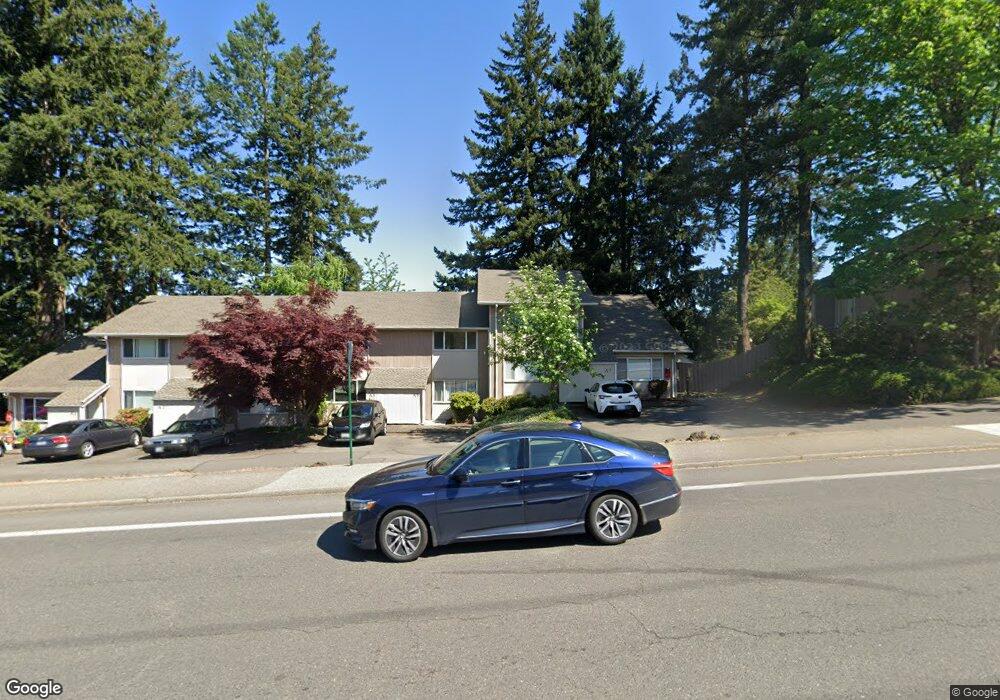
2300 9th Ave SW Unit B5 Olympia, WA 98502
South Westside NeighborhoodEstimated Value: $209,000 - $271,000
2
Beds
2
Baths
896
Sq Ft
$260/Sq Ft
Est. Value
About This Home
This home is located at 2300 9th Ave SW Unit B5, Olympia, WA 98502 and is currently estimated at $232,860, approximately $259 per square foot. 2300 9th Ave SW Unit B5 is a home located in Thurston County with nearby schools including Leland P. Brown Elementary School, Jefferson Middle School, and Capital High School.
Ownership History
Date
Name
Owned For
Owner Type
Purchase Details
Closed on
Nov 2, 2004
Sold by
Solie Robert L and Whitney Solie Janice
Bought by
Naughton John F
Current Estimated Value
Home Financials for this Owner
Home Financials are based on the most recent Mortgage that was taken out on this home.
Original Mortgage
$74,080
Outstanding Balance
$36,746
Interest Rate
5.69%
Mortgage Type
Unknown
Estimated Equity
$196,114
Purchase Details
Closed on
Sep 26, 2003
Sold by
Evans James L
Bought by
Solie Robert L and Whitney Solie Janice
Home Financials for this Owner
Home Financials are based on the most recent Mortgage that was taken out on this home.
Original Mortgage
$60,000
Interest Rate
6.22%
Mortgage Type
Unknown
Purchase Details
Closed on
Feb 29, 1996
Sold by
Jenkins Melissa A
Bought by
Evans James L
Home Financials for this Owner
Home Financials are based on the most recent Mortgage that was taken out on this home.
Original Mortgage
$46,400
Interest Rate
7%
Create a Home Valuation Report for This Property
The Home Valuation Report is an in-depth analysis detailing your home's value as well as a comparison with similar homes in the area
Home Values in the Area
Average Home Value in this Area
Purchase History
| Date | Buyer | Sale Price | Title Company |
|---|---|---|---|
| Naughton John F | $98,500 | Thurston County Title | |
| Naughton John F | -- | Thurston County Title | |
| Solie Robert L | $75,000 | Thurston County Title | |
| Evans James L | $58,000 | First American Title |
Source: Public Records
Mortgage History
| Date | Status | Borrower | Loan Amount |
|---|---|---|---|
| Open | Naughton John F | $74,080 | |
| Previous Owner | Solie Robert L | $60,000 | |
| Previous Owner | Evans James L | $46,400 |
Source: Public Records
Tax History Compared to Growth
Tax History
| Year | Tax Paid | Tax Assessment Tax Assessment Total Assessment is a certain percentage of the fair market value that is determined by local assessors to be the total taxable value of land and additions on the property. | Land | Improvement |
|---|---|---|---|---|
| 2024 | $2,043 | $223,000 | $93,500 | $129,500 |
| 2023 | $2,043 | $194,800 | $69,900 | $124,900 |
| 2022 | $1,752 | $181,000 | $57,400 | $123,600 |
| 2021 | $1,570 | $146,100 | $59,000 | $87,100 |
| 2020 | $1,378 | $121,100 | $54,500 | $66,600 |
| 2019 | $1,341 | $103,600 | $43,500 | $60,100 |
| 2018 | $1,230 | $91,100 | $41,300 | $49,800 |
| 2017 | $1,038 | $82,500 | $35,000 | $47,500 |
| 2016 | $829 | $75,500 | $30,500 | $45,000 |
| 2014 | -- | $65,800 | $27,200 | $38,600 |
Source: Public Records
Map
Nearby Homes
- 2300 9th Ave SW Unit A5
- 933 Fern St SW Unit 933
- 1405 Fern St SW
- 2004 15th Ave SW
- 821 Thomas St SW
- 113 Decatur St NW
- 1516 Decatur St SW Unit 210
- 1709 Fern St SW
- 236 Milroy St NW
- 4937 Black Lake Blvd SW
- 2021 Bush Ave NW
- 303 Decatur St NW
- 101 Rogers St NW
- 1111 Archwood Dr SW Unit 196
- 1111 Archwood Dr SW Unit 361
- 1111 Archwood Dr SW Unit 324
- 133 Rogers St NW
- 1111 Archwood Dr SW Unit 450
- 1111 Archwood Dr SW Unit 375
- 1111 Archwood Dr SW Unit 345
- 2300 9th Ave SW Unit 2-4
- 2300 9th Ave SW Unit 2300
- 2300 9th Ave SW Unit C5
- 2300 9th Ave SW Unit C3
- 2300 9th Ave SW Unit C2
- 2300 9th Ave SW Unit B7
- 2300 9th Ave SW Unit B6
- 2300 9th Ave SW Unit B4
- 2300 9th Ave SW Unit B3
- 2300 9th Ave SW Unit B2
- 2300 9th Ave SW Unit B1
- 2300 9th Ave SW Unit A6
- 2300 9th Ave SW Unit A4
- 2300 9th Ave SW Unit A3
- 2300 9th Ave SW Unit A2
- 2300 9th Ave SW Unit A1
- 2300 9th Ave SW
- 2300 9th Sw C-4 Ave Unit 2300
- 2300 9th Sw B-2 Ave Unit 2300
- 2300 9th Sw #7 Ave Unit 2300