NOT LISTED FOR SALE

Estimated Value: $992,568 - $1,108,000

2 Beds
3 Baths
2,334 Sq Ft
$443/Sq Ft Est. Value

Last Sold May 16, 2017

Last sale price $590,000 $253 Per Sq Ft

Est. 75% increase in value since last sale

Current estimated payment $5,956/month

About This Home

As of May 2017

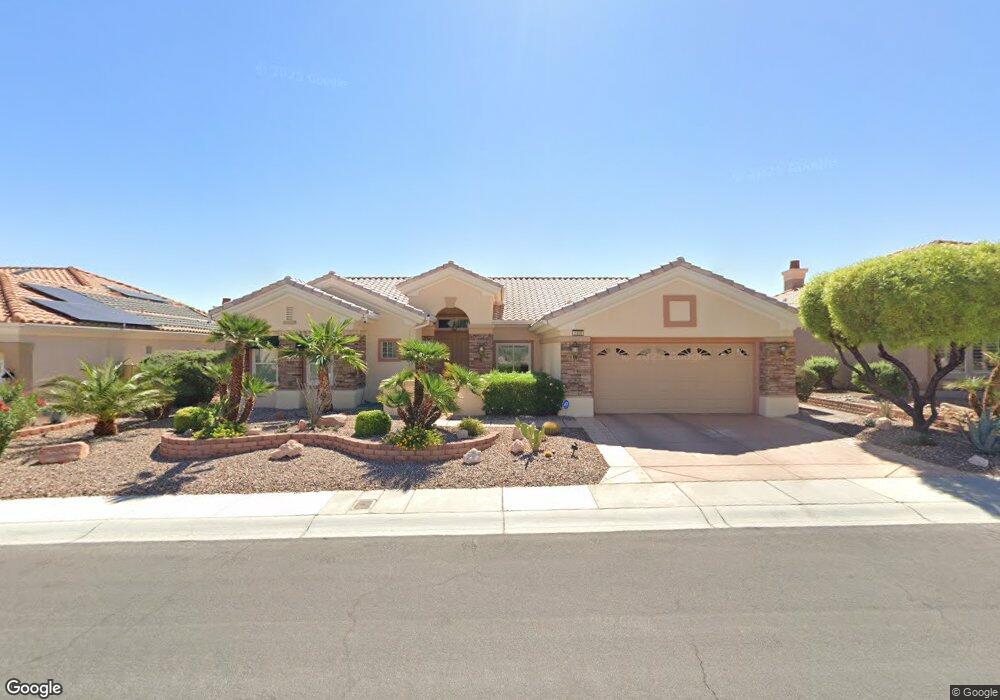
This home is located at 2300 Airlands St, Las Vegas, NV 89134 and is currently estimated at $1,033,142, approximately $442 per square foot. 2300 Airlands St is a home located in Clark County with nearby schools including Ethel W. Staton Elementary School, Ernest Becker Middle School, and Palo Verde High School.

Ownership History

Date Name Owned For Owner Type

Purchase Details

Listed on
Aug 29, 2016
Closed on
May 12, 2017
Sold by
Ferraro Stanley and Ferraro Florence F
Bought by
Jeming Peter and Jeming Verna J
Seller's Agent
Don Egbert
BHHS Nevada Properties
Buyer's Agent
Arlene Gawne
Signature Real Estate Group
List Price
$625,000
Sold Price
$590,000
Premium/Discount to List
-$35,000
-5.6%
Current Estimated Value
$1,033,142

Home Financials for this Owner

Home Financials are based on the most recent Mortgage that was taken out on this home.
Estimated Appreciation
$443,142
Avg. Annual Appreciation
6.86%

Purchase Details

Closed on
May 5, 1997
Sold by
Del Webb Communities Inc
Bought by
Ferraro Stanley and Ferraro Florence F

Home Financials for this Owner

Home Financials are based on the most recent Mortgage that was taken out on this home.
Original Mortgage
$335,000
Interest Rate
7.91%
Source: Public Records

Range of Values:

Collateral Analytics

Collateral Analytics Collateral Analytics AVMs (Automated Valuation Model) employ a number of statistical approaches combined with neighborhood-specific comparable selection guarantees the most up-to-date and precise valuations.

Not Available

Collateral Analytics does not have data for the current month. Please view the chart for historical values.

ICE

ICE Mortgage Technology ICE Mortgage Technology’s AVM (Automated Valuation Model) is a state-of-the-art online residential property valuation tool that provides a quick and accurate estimate of the value of almost any home in the U.S.

Not Available

ICE Mortgage Technology does not have data for the current month. Please view the chart for historical values.

First American

First American First American Data & Analytics’ next-generation AVM combines unrivaled data assets with a blended ensemble of valuation models to produce highly accurate, reliable valuations you can trust.

Not Available

First American does not have data for the current month. Please view the chart for historical values.

Quantarium

Quantarium Quantarium’s valuation service, repeatedly proven the industry’s most accurate and comprehensive, is supercharged with a self-learning and auto-tuning AI engine that continually becomes smarter and more accurate as it processes daily inputs from the industry’s leading RE data lake.

Not Available

Quantarium does not have data for the current month. Please view the chart for historical values.

Average Value
Not Available
List Price
Sold Price
Create a Home Valuation Report for This Property
The Home Valuation Report is an in-depth analysis detailing your home's value as well as a comparison with similar homes in the area

Home Values in the Area

Source: Public Records

Average Home Value in this Area


Source: Public Records

Purchase History

Date Buyer Sale Price Title Company
Jeming Peter $590,000 Ort Co Of Nevada
Ferraro Stanley $442,000 First American Title Co
Source: Public Records

Mortgage History

Date Status Borrower Loan Amount
Previous Owner Ferraro Stanley $335,000
Source: Public Records

Property History

Date Event Price List to Sale Price per Sq Ft Prior Sale
05/16/2017 05/16/17 Sold $590,000 -5.6% $253 / Sq Ft View Prior Sale
04/16/2017 04/16/17 Pending -- -- --
08/29/2016 08/29/16 For Sale $625,000 -- $268 / Sq Ft

Tax History Compared to Growth

Source: Public Records

Tax History

Year Tax Paid Tax Assessment Tax Assessment Total Assessment is a certain percentage of the fair market value that is determined by local assessors to be the total taxable value of land and additions on the property. Land Improvement
2025 $5,932 $224,411 $119,455 $104,956
2024 $5,760 $224,411 $119,455 $104,956
2023 $5,760 $213,961 $114,135 $99,826
2022 $5,592 $191,449 $100,170 $91,279
2021 $5,429 $178,107 $90,860 $87,247
2020 $5,268 $176,132 $89,530 $86,602
2019 $5,115 $169,063 $83,545 $85,518
2018 $4,966 $157,452 $74,900 $82,552
2017 $5,048 $153,118 $70,245 $82,873
2016 $4,701 $149,270 $66,255 $83,015
2015 $4,692 $145,588 $63,595 $81,993
2014 $3,736 $134,067 $63,595 $70,472
Source: Public Records

Agents Affiliated with this Home

  • Section Image
  • Section Image
See All Agents

Map