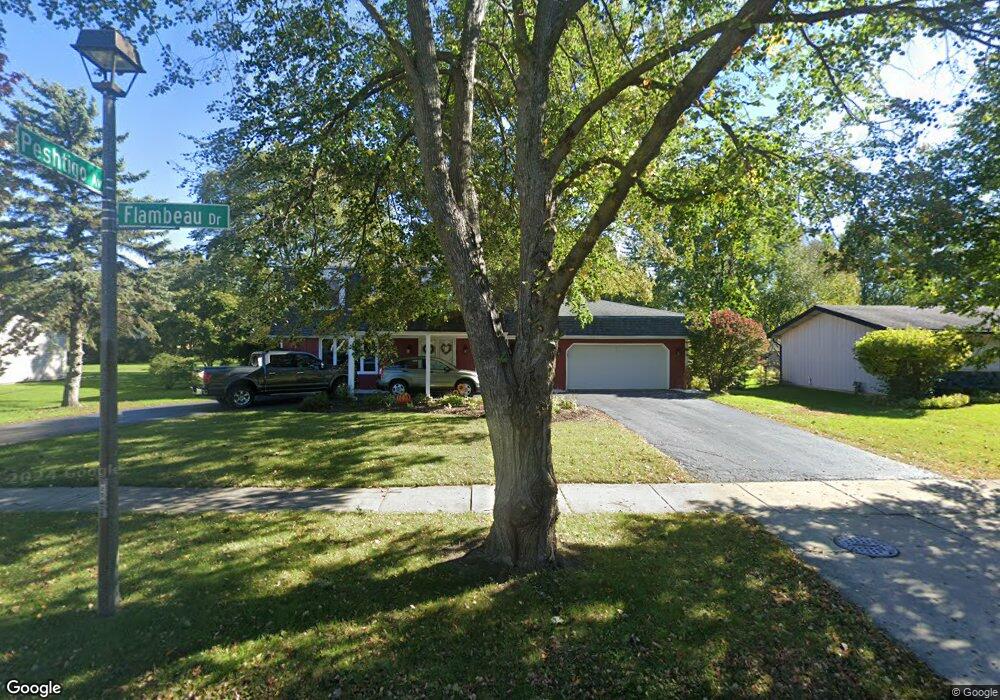
2300 Flambeau Dr Naperville, IL 60564
Springbrook Prairie NeighborhoodEstimated Value: $536,000 - $765,000
--
Bed
1
Bath
2,634
Sq Ft
$234/Sq Ft
Est. Value
About This Home
This home is located at 2300 Flambeau Dr, Naperville, IL 60564 and is currently estimated at $615,814, approximately $233 per square foot. 2300 Flambeau Dr is a home located in Will County with nearby schools including Robert Clow Elementary School, Ellsworth Elementary School, and Gordon Gregory Middle School.
Ownership History
Date
Name
Owned For
Owner Type
Purchase Details
Closed on
Sep 26, 2001
Sold by
Brinegar Allen L and Brinegar Karen S
Bought by
Montalbano Richard M and Montalbano Wendy L
Current Estimated Value
Home Financials for this Owner
Home Financials are based on the most recent Mortgage that was taken out on this home.
Original Mortgage
$217,200
Outstanding Balance
$83,963
Interest Rate
6.72%
Estimated Equity
$531,851
Purchase Details
Closed on
Jul 27, 1995
Sold by
Carroll Brian M and Carroll Lynn M
Bought by
Brinegar Allen L and Brinegar Karen S
Home Financials for this Owner
Home Financials are based on the most recent Mortgage that was taken out on this home.
Original Mortgage
$100,000
Interest Rate
7.51%
Create a Home Valuation Report for This Property
The Home Valuation Report is an in-depth analysis detailing your home's value as well as a comparison with similar homes in the area
Home Values in the Area
Average Home Value in this Area
Purchase History
| Date | Buyer | Sale Price | Title Company |
|---|---|---|---|
| Montalbano Richard M | $271,500 | Chicago Title Insurance Co | |
| Brinegar Allen L | $205,000 | Chicago Title Insurance Co |
Source: Public Records
Mortgage History
| Date | Status | Borrower | Loan Amount |
|---|---|---|---|
| Open | Montalbano Richard M | $217,200 | |
| Previous Owner | Brinegar Allen L | $100,000 |
Source: Public Records
Tax History Compared to Growth
Tax History
| Year | Tax Paid | Tax Assessment Tax Assessment Total Assessment is a certain percentage of the fair market value that is determined by local assessors to be the total taxable value of land and additions on the property. | Land | Improvement |
|---|---|---|---|---|
| 2024 | $11,740 | $187,245 | $36,274 | $150,971 |
| 2023 | $11,740 | $165,411 | $32,044 | $133,367 |
| 2022 | $10,797 | $155,028 | $30,312 | $124,716 |
| 2021 | $10,318 | $147,646 | $28,869 | $118,777 |
| 2020 | $10,121 | $145,307 | $28,412 | $116,895 |
| 2019 | $9,946 | $141,212 | $27,611 | $113,601 |
| 2018 | $9,833 | $137,268 | $27,003 | $110,265 |
| 2017 | $9,681 | $133,724 | $26,306 | $107,418 |
| 2016 | $9,662 | $130,846 | $25,740 | $105,106 |
| 2015 | $9,792 | $125,813 | $24,750 | $101,063 |
| 2014 | $9,792 | $125,033 | $24,750 | $100,283 |
| 2013 | $9,792 | $125,033 | $24,750 | $100,283 |
Source: Public Records
Map
Nearby Homes
- 2224 Flambeau Dr
- 1321 Galena Ct
- 2301 Mecan Dr
- 1329 Neskola Ct
- 1305 Morningstar Ct Unit 1A
- 1134 Gateshead Dr
- 28W555 Leverenz Rd
- 2636 Salix Cir
- 567 Roxbury Dr
- 2741 Gateshead Dr
- 2206 Gleneagles Dr
- 1123 Thackery Ln
- 3004 Bennett Dr
- 2949 Brossman St
- 2203 Fox Boro Ln
- 2207 Sisters Ave
- 2543 Dewes Ln
- 3212 Austin Ct
- 445 Travelaire Ave
- 945 Winners Cup Ct Unit 945
- 2244 Flambeau Dr
- 2304 Flambeau Dr
- 2301 Flambeau Dr
- 1301 Peshtigo Ave Unit 1
- 2240 Flambeau Dr Unit 1
- 2308 Flambeau Dr
- 10S160 Meadow Ln
- 10S174 Meadow Ln
- 10S146 Meadow Ln
- 1301 Galena Ct
- 1304 Peshtigo Ave
- 1305 Peshtigo Ave
- 2237 Flambeau Dr
- 10S134 Meadow Ln
- 10S180 Meadow Ln Unit 5
- 2232 Flambeau Dr
- 1305 Galena Ct
- 1304 Oconto Ct
- 1308 Peshtigo Ave
- 1309 Peshtigo Ave