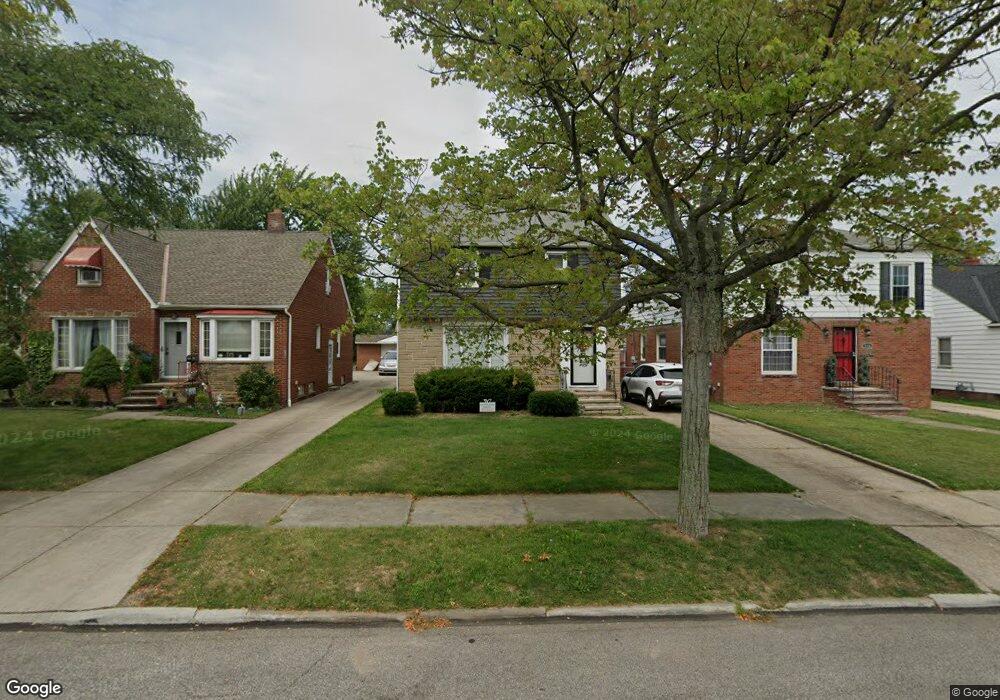
2300 North Ave Cleveland, OH 44134
Estimated Value: $201,812 - $224,000
3
Beds
1
Bath
1,248
Sq Ft
$168/Sq Ft
Est. Value
About This Home
This home is located at 2300 North Ave, Cleveland, OH 44134 and is currently estimated at $209,703, approximately $168 per square foot. 2300 North Ave is a home located in Cuyahoga County with nearby schools including John Muir Elementary School, Shiloh Middle School, and Parma High School.
Ownership History
Date
Name
Owned For
Owner Type
Purchase Details
Closed on
Apr 27, 2022
Sold by
Shea Thomas H and Shea Ann Bonnie
Bought by
Moore Amanda and Negron Juan
Current Estimated Value
Home Financials for this Owner
Home Financials are based on the most recent Mortgage that was taken out on this home.
Original Mortgage
$132,275
Outstanding Balance
$125,658
Interest Rate
5.25%
Mortgage Type
FHA
Estimated Equity
$84,045
Purchase Details
Closed on
Jun 10, 2008
Sold by
Schaffner E Bruce
Bought by
Shea Thomas H
Home Financials for this Owner
Home Financials are based on the most recent Mortgage that was taken out on this home.
Original Mortgage
$100,107
Interest Rate
6.09%
Mortgage Type
VA
Purchase Details
Closed on
Jun 8, 2005
Sold by
Kravic Anne
Bought by
Kravic Anne
Purchase Details
Closed on
Feb 11, 1992
Sold by
Krewnich Mary
Bought by
Kravic Anne
Purchase Details
Closed on
Jan 1, 1975
Bought by
Krewnich Mary
Create a Home Valuation Report for This Property
The Home Valuation Report is an in-depth analysis detailing your home's value as well as a comparison with similar homes in the area
Home Values in the Area
Average Home Value in this Area
Purchase History
| Date | Buyer | Sale Price | Title Company |
|---|---|---|---|
| Moore Amanda | $175,000 | Cleveland Home Title | |
| Shea Thomas H | $98,000 | Resource Title Agency Inc | |
| Kravic Anne | -- | Public | |
| Kravic Anne | -- | -- | |
| Krewnich Mary | -- | -- |
Source: Public Records
Mortgage History
| Date | Status | Borrower | Loan Amount |
|---|---|---|---|
| Open | Moore Amanda | $132,275 | |
| Previous Owner | Shea Thomas H | $100,107 |
Source: Public Records
Tax History Compared to Growth
Tax History
| Year | Tax Paid | Tax Assessment Tax Assessment Total Assessment is a certain percentage of the fair market value that is determined by local assessors to be the total taxable value of land and additions on the property. | Land | Improvement |
|---|---|---|---|---|
| 2024 | $3,486 | $57,260 | $11,725 | $45,535 |
| 2023 | $3,005 | $42,210 | $9,660 | $32,550 |
| 2022 | $2,977 | $42,210 | $9,660 | $32,550 |
| 2021 | $3,062 | $42,210 | $9,660 | $32,550 |
| 2020 | $2,680 | $32,450 | $7,420 | $25,030 |
| 2019 | $2,565 | $92,700 | $21,200 | $71,500 |
| 2018 | $2,391 | $32,450 | $7,420 | $25,030 |
| 2017 | $2,365 | $27,590 | $5,570 | $22,020 |
| 2016 | $2,350 | $27,590 | $5,570 | $22,020 |
| 2015 | $2,237 | $27,590 | $5,570 | $22,020 |
| 2014 | $2,237 | $28,140 | $5,670 | $22,470 |
Source: Public Records
Map
Nearby Homes
- 2129 North Ave
- 1716 Tuxedo Ave
- 2302 Brookdale Ave
- 2137 Silverdale Ave
- 5231 W 16th St
- 2923 Brookview Blvd
- 2503 Brookdale Ave
- 3000 Brookpark Rd Unit R10
- 2831 Walbrook Ave
- 2712 Ralph Ave
- 2923 Brookdale Ave
- 3323 North Ave
- 4884 W 13th St
- 3107 Brookdale Ave
- 3402 North Ave
- 3310 Walbrook Ave
- 4859 W 13th St
- 5553 Sunset Ln Unit A15-F
- 3430 Brookview Blvd
- 1917 Alvin Ave
- 2226 North Ave
- 2304 North Ave
- 2222 North Ave
- 2308 North Ave
- 2218 North Ave
- 2229 Brookview Blvd
- 2303 Brookview Blvd
- 2311 Brookview Blvd
- 2214 North Ave
- 2314 North Ave
- 2225 Brookview Blvd
- 2221 Brookview Blvd
- 2285 North Ave
- 2210 North Ave
- 2318 North Ave
- 2315 Brookview Blvd
- 2301 North Ave
- 2303 North Ave
- 2213 Brookview Blvd
- 2225 North Ave