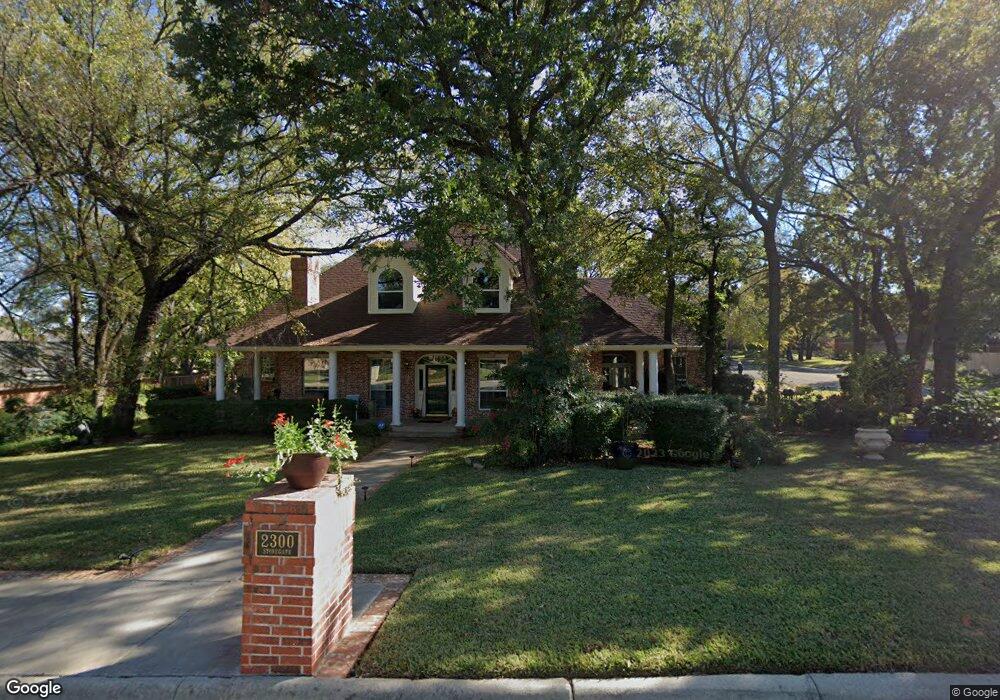
2300 Stonegate Cir Denton, TX 76205
South Denton NeighborhoodEstimated Value: $654,322 - $733,000
4
Beds
4
Baths
3,918
Sq Ft
$180/Sq Ft
Est. Value
About This Home
This home is located at 2300 Stonegate Cir, Denton, TX 76205 and is currently estimated at $707,081, approximately $180 per square foot. 2300 Stonegate Cir is a home located in Denton County with nearby schools including Houston Elementary School, McMath Middle School, and Denton High School.
Ownership History
Date
Name
Owned For
Owner Type
Purchase Details
Closed on
Aug 4, 2021
Sold by
Hill Donald H and Hill Gail F
Bought by
Hill Donald H and Hill Gail F
Current Estimated Value
Purchase Details
Closed on
Aug 28, 2002
Sold by
Voight James R and Voight Keitha B
Bought by
Hill Donald H and Hill Gail
Home Financials for this Owner
Home Financials are based on the most recent Mortgage that was taken out on this home.
Original Mortgage
$94,500
Outstanding Balance
$39,735
Interest Rate
6.33%
Estimated Equity
$667,346
Purchase Details
Closed on
Dec 19, 1997
Sold by
Little Wendell and Little Ann
Bought by
Voight James R and Voight Keitha B
Home Financials for this Owner
Home Financials are based on the most recent Mortgage that was taken out on this home.
Original Mortgage
$295,000
Interest Rate
7.12%
Create a Home Valuation Report for This Property
The Home Valuation Report is an in-depth analysis detailing your home's value as well as a comparison with similar homes in the area
Home Values in the Area
Average Home Value in this Area
Purchase History
| Date | Buyer | Sale Price | Title Company |
|---|---|---|---|
| Hill Donald H | -- | None Available | |
| Hill Donald H | -- | -- | |
| Voight James R | -- | -- |
Source: Public Records
Mortgage History
| Date | Status | Borrower | Loan Amount |
|---|---|---|---|
| Open | Hill Donald H | $94,500 | |
| Previous Owner | Voight James R | $295,000 | |
| Closed | Hill Donald H | $207,100 |
Source: Public Records
Tax History Compared to Growth
Tax History
| Year | Tax Paid | Tax Assessment Tax Assessment Total Assessment is a certain percentage of the fair market value that is determined by local assessors to be the total taxable value of land and additions on the property. | Land | Improvement |
|---|---|---|---|---|
| 2025 | $5,504 | $626,154 | $174,558 | $502,691 |
| 2024 | $10,987 | $569,231 | $0 | $0 |
| 2023 | $5,513 | $517,483 | $174,558 | $418,883 |
| 2022 | $9,987 | $470,439 | $139,646 | $385,317 |
| 2021 | $9,507 | $427,672 | $82,915 | $344,757 |
| 2020 | $9,866 | $431,634 | $82,915 | $348,719 |
| 2019 | $10,119 | $424,082 | $82,915 | $341,167 |
| 2018 | $10,479 | $433,813 | $82,915 | $350,898 |
| 2017 | $10,777 | $435,994 | $82,915 | $365,031 |
| 2016 | $7,988 | $396,358 | $82,915 | $313,443 |
| 2015 | $7,880 | $391,138 | $66,332 | $324,806 |
| 2013 | -- | $360,939 | $66,332 | $294,607 |
Source: Public Records
Map
Nearby Homes
- 2253 Hollyhill Ln
- 2272 Hollyhill Ln
- 924 Ridgecrest Cir
- 2544 Natchez Trace
- 2218 Southridge Dr
- 209 Pennsylvania Dr
- 916 Smokerise Cir
- 1412 Ridgecrest Cir
- 720 Smokerise Cir
- 1012 Indian Ridge Dr
- 2009 Lake Fork Ct
- 2501 Great Bear Ln
- 1000 Lynhurst Ln
- 1108 Ellison Park Cir
- 2012 Hollyhill Ln
- 2000 Lamprey Cir
- 2312 Caddo Cir
- 2226 Savannah Trail
- 829 Skylark Dr
- 2209 Loon Lake Rd
- 2304 Stonegate Cir
- 2301 Hollyhill Ln
- 2305 Hollyhill Ln
- 2256 Stonegate Dr
- 2265 Hollyhill Ln
- 2305 Stonegate Cir
- 2308 Stonegate Cir
- 2420 Southridge Dr
- 2309 Hollyhill Ln
- 2252 Stonegate Dr
- 2300 Hollyhill Ln
- 2415 Southridge Dr
- 2261 Hollyhill Ln
- 2309 Stonegate Cir
- 2249 Stonegate Dr
- 2304 Hollyhill Ln
- 729 Ridgecrest Cir
- 2416 Southridge Dr
- 2312 Stonegate Cir
- 2313 Hollyhill Ln