2300 Trellis Ct Raleigh, NC 27604
Northeast Raleigh NeighborhoodEstimated Value: $504,000 - $530,000
3
Beds
3
Baths
2,361
Sq Ft
$219/Sq Ft
Est. Value
About This Home
This home is located at 2300 Trellis Ct, Raleigh, NC 27604 and is currently estimated at $516,491, approximately $218 per square foot. 2300 Trellis Ct is a home located in Wake County with nearby schools including Forestville Road Elementary School, Neuse River Middle School, and Knightdale High.
Ownership History
Date
Name
Owned For
Owner Type
Purchase Details
Closed on
Mar 26, 2015
Sold by
Wilson Melissa
Bought by
Blanchard Jason and Blanchard Molly
Current Estimated Value
Home Financials for this Owner
Home Financials are based on the most recent Mortgage that was taken out on this home.
Original Mortgage
$258,300
Outstanding Balance
$198,632
Interest Rate
3.79%
Mortgage Type
New Conventional
Estimated Equity
$317,859
Purchase Details
Closed on
Oct 27, 2006
Sold by
Wilson Melissa and Long Melissa B
Bought by
Wilson Michael L and Wilson Melissa
Home Financials for this Owner
Home Financials are based on the most recent Mortgage that was taken out on this home.
Original Mortgage
$184,500
Interest Rate
6.31%
Mortgage Type
New Conventional
Purchase Details
Closed on
Jun 30, 1995
Bought by
Wilson Melissa and Wilson Michael L
Create a Home Valuation Report for This Property
The Home Valuation Report is an in-depth analysis detailing your home's value as well as a comparison with similar homes in the area
Home Values in the Area
Average Home Value in this Area
Purchase History
| Date | Buyer | Sale Price | Title Company |
|---|---|---|---|
| Blanchard Jason | $287,000 | None Available | |
| Wilson Michael L | -- | None Available | |
| Wilson Melissa | $200,000 | -- |
Source: Public Records
Mortgage History
| Date | Status | Borrower | Loan Amount |
|---|---|---|---|
| Open | Blanchard Jason | $258,300 | |
| Previous Owner | Wilson Michael L | $184,500 |
Source: Public Records
Tax History Compared to Growth
Tax History
| Year | Tax Paid | Tax Assessment Tax Assessment Total Assessment is a certain percentage of the fair market value that is determined by local assessors to be the total taxable value of land and additions on the property. | Land | Improvement |
|---|---|---|---|---|
| 2025 | $3,226 | $501,277 | $95,000 | $406,277 |
| 2024 | $3,133 | $501,277 | $95,000 | $406,277 |
| 2023 | $2,640 | $335,969 | $80,000 | $255,969 |
| 2022 | $2,446 | $335,969 | $80,000 | $255,969 |
| 2021 | $2,381 | $335,969 | $80,000 | $255,969 |
| 2020 | $2,342 | $335,969 | $80,000 | $255,969 |
| 2019 | $2,208 | $267,870 | $70,000 | $197,870 |
| 2018 | $2,030 | $267,870 | $70,000 | $197,870 |
| 2017 | $1,925 | $267,870 | $70,000 | $197,870 |
| 2016 | $1,886 | $267,870 | $70,000 | $197,870 |
| 2015 | $1,999 | $284,944 | $74,000 | $210,944 |
| 2014 | $1,895 | $284,944 | $74,000 | $210,944 |
Source: Public Records
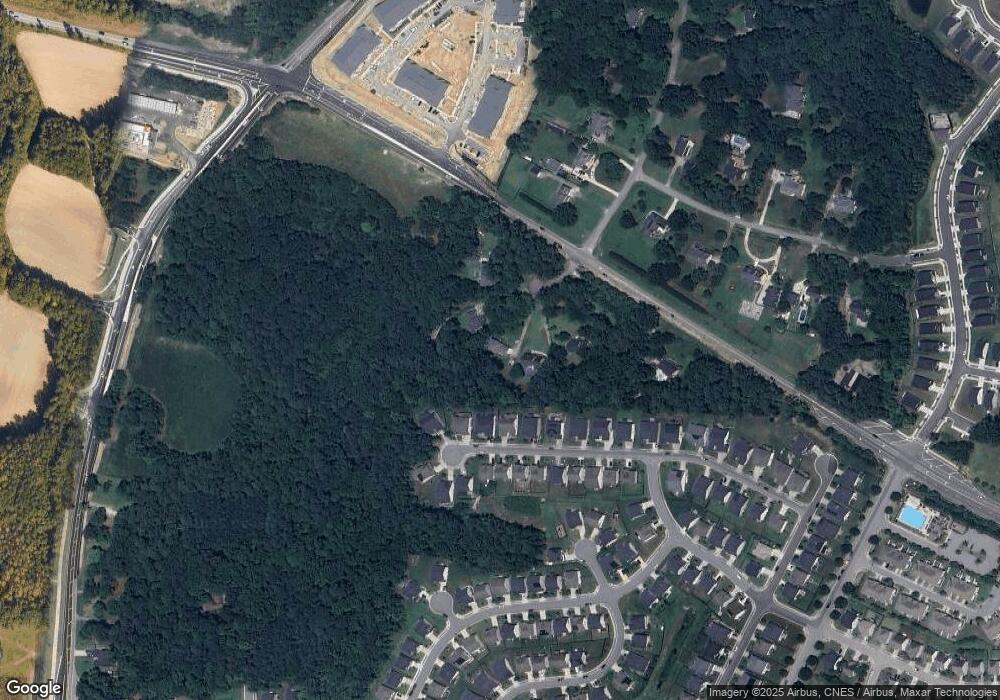
Map
Nearby Homes
- 7454 Randshire Way
- 7613 Oakberry Dr
- 7535 Mapleshire Dr
- 7536 Oakberry Dr
- 7316 Birchshire Dr
- 3932 Mount Moran Rd
- LANSING - TRADITIONS Plan at Chapel Townes
- CARSON - TRADITIONS Plan at Chapel Townes
- DENVER - TRADITIONS Plan at Chapel Townes
- 4004 Mount Moran Rd
- 3917 Mount Moran Rd
- 7636 Birchmoor Way
- 7725 Weathered Oak Way
- 7727 Weathered Oak Way
- 7661 Mapleshire Dr
- 7817 Elmshire Way
- 7301 Vanover Dr
- Callaway Plan at Peace River Village Single Family
- Bordeaux Plan at Peace River Village Single Family
- Malbec Plan at Peace River Village Single Family
- 2301 Trellis Ct
- 2304 Trellis Ct
- 7410 Randshire Way
- 7414 Randshire Way
- 7406 Randshire Way
- 7406 Round Oak Rd
- 7418 Randshire Way
- 7402 Randshire Way
- 7422 Randshire Way
- 7633 Randshire Way
- 2308 Trellis Ct
- 2309 Trellis Ct
- 7426 Randshire Way
- 7415 Randshire Way
- 7419 Randshire Way
- 7411 Randshire Way
- 7427 Randshire Way
- 7403 Randshire Way
- 7430 Randshire Way
- 7431 Randshire Way